You’ve probably noticed your electricity bill creeping higher each month, but you can’t pinpoint exactly what’s draining your wallet. Arduino energy monitors offer a straightforward solution that transforms your home into a data-driven powerhouse without requiring an electrical engineering degree. These compact devices track your real-time energy consumption, revealing which appliances are secretly inflating your costs. The question isn’t whether you need better energy insights—it’s how quickly you can start saving money.
Essential Hardware Components for Arduino Energy Monitoring
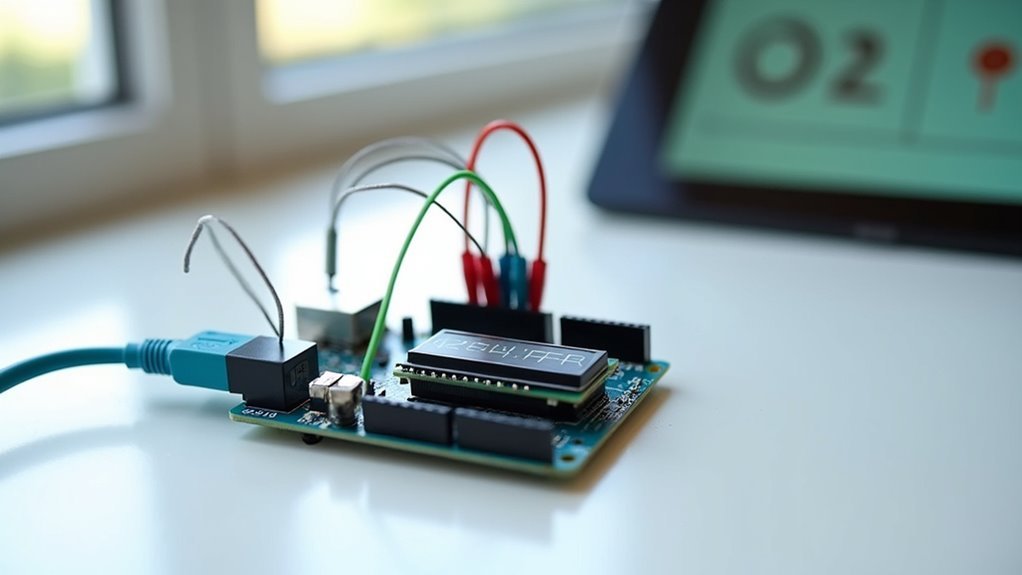
Building an effective Arduino energy monitoring system requires several key hardware components working together.
You’ll need CD clamp current sensors to measure electrical current flowing through your circuits, providing accurate readings for your home energy calculations. The ZMPT101B AC voltage sensor handles voltage measurement and requires precise calibration using a potentiometer to guarantee reliable readings under fluctuating conditions.
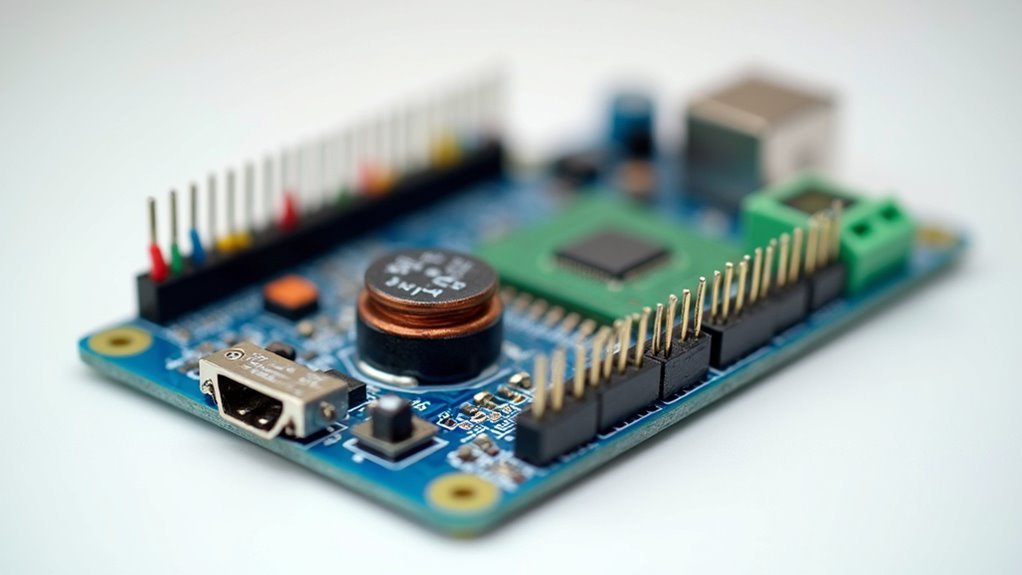
Your Arduino Nano or Uno serves as the central microcontroller, processing sensor data and executing power consumption calculations. For monitoring split-phase 120/240 service, you’ll use current transformers with a 0.32 calibration value for 100 amp CTs.
An SSD1306 I2C OLED display provides visual output for your energy monitor. Proper connections are critical—connect VCC and ground pins for sensors, with current and voltage sensor outputs going to analog pins A0 and A1.
Required Libraries and Software Setup
Once you’ve gathered your hardware components, you’ll need to install several libraries to make your Arduino energy monitor function properly.
Start by downloading Adafruit GFX and Adafruit SSD1306 for display functionality, plus BlynkSimpleEthernet and ZMPT101B libraries for sensor readings. Access these through Arduino IDE’s Library Manager or download them directly from GitHub repositories.
Essential libraries include Adafruit GFX, SSD1306, BlynkSimpleEthernet, and ZMPT101B – available through Arduino IDE’s Library Manager or GitHub.
Next, configure your Blynk app connection by generating a unique authentication token within the app after setting up your device.
Install TimeLib and WidgetRTC libraries to enable accurate time management and track energy usage over specific intervals like daily kilowatt-hour calculations.
Finally, initialize Serial communication at 115200 baud rate in your code. This guarantees proper data output for real-time monitoring through the Serial Monitor, giving you immediate feedback on your energy consumption patterns.
Understanding Split Phase 120/240 Electrical Service Monitoring
You’ll need to calibrate your current transformers properly to guarantee accurate readings from both phases of your 120/240V electrical service.
Once calibrated, you can calculate total power consumption by measuring RMS current from each phase and applying the standard power formula.
This setup enables you to monitor real-time energy usage and track kilowatt-hours across your entire electrical panel.
Current Transformer Calibration Process
Accurate current transformer calibration forms the foundation of reliable energy monitoring in split phase 120/240 electrical systems.
You’ll need to establish proper calibration values to guarantee your Arduino captures precise current readings from your 100 amp CT.
Your calibration process involves three critical steps:
- Set the calibration factor – Configure your 100 amp CT with a calibration value of 0.32 for maximum accuracy.
- Calculate zero values – Determine baseline readings using maximum and minimum current observations to establish true RMS current.
- Compute RMS measurements – Apply the formula (maxCurrent – zero) × calibration to calculate reliable current values.
You’ll then calculate RMS power by multiplying your voltage readings (121.2 volts) with corresponding RMS current values.
Regular testing against known meters validates your measurement accuracy.
Dual Phase Power Calculations
When monitoring split phase 120/240 electrical service with your Arduino, you’re fundamentally tracking two separate 120V lines that work together to provide both 120V and 240V power to your home.
You’ll need current transformers on each phase, calibrated at 0.32 for 100 amp CTs to guarantee accurate readings.
Calculate RMS current using the formula: (maxCurrent – zero) * calibration for each phase individually. This gives you precise current measurements over time.
To determine total power consumption, multiply each phase’s voltage by its RMS current, then sum both results.
For thorough energy tracking, integrate power usage over time to calculate kilowatt-hours, resetting daily at 23:59 for accurate consumption monitoring.
Real-Time Data Monitoring
Real-time monitoring transforms your Arduino energy system from a simple data collector into a dynamic dashboard that displays current consumption as it happens.
You’ll receive instant feedback about your electrical usage patterns, making it easier to identify power-hungry appliances and optimize your energy consumption.
Your monitoring system provides three key real-time metrics:
- Current measurements in amperes – Track the actual current flowing through each phase of your 120/240V service.
- Power consumption in watts – Monitor instantaneous power usage for both individual phases and total system load.
- Kilowatt hours – Observe accumulated energy consumption over time to understand long-term usage trends.
The Blynk app interface delivers this data directly to your smartphone, enabling you to make informed decisions about your energy usage wherever you are.
Current Transformer Calibration and Configuration
After installing your current transformer, you’ll need to calibrate it properly to secure accurate energy measurements from your Arduino monitor. For a 100 amp CT, set your calibration value to 0.32 in your code. This guarantees precise current readings for power calculations.
Your system calculates a zero baseline using maximum and minimum readings, which establishes the reference point for RMS current calculations. The RMS current formula is: (maxCurrent – zero) * calibration. This computation enables accurate power consumption measurements.
To verify accuracy, compare your Arduino readings with an MPM meter. If values don’t align, adjust calibration through programming modifications or add a potentiometer for real-time fine-tuning.
Proper calibration secures your energy monitor delivers reliable, precise measurements for effective home energy management.
Voltage Sensor Integration and Accuracy Optimization
While current transformers measure the flow of electricity, voltage sensors complete your Arduino energy monitor by tracking electrical potential fluctuations that can damage sensitive appliances.
The ZMPT101B AC voltage sensor integrates seamlessly into your setup, connecting its output pin directly to Arduino analog pin A0 for precise voltage readings.
You’ll need to calibrate the sensor using its built-in potentiometer to match actual voltage readings, which typically fluctuate between 179-181 volts during testing.
Here’s your optimization process:
- Connect the ZMPT101B output to Arduino pin A0 for proper analog signal processing
- Adjust the potentiometer while comparing readings with a multimeter for accuracy verification
- Calculate RMS power using the formula: Volts * RMSCurrent for complete energy monitoring
This accuracy guarantees reliable power consumption calculations displayed on your OLED screen.
Real-Time Current and Power Measurement Techniques
You’ll need to properly calibrate your current transformers to achieve accurate real-time measurements in your Arduino energy monitor.
Start by setting the calibration value to 0.32 for 100 amp CTs connected to analog pins A0 and A1, then calculate RMS current by finding the difference between maximum and minimum readings.
Your power calculations become straightforward once you multiply the RMS current by your fixed voltage value of 121.2 volts to determine actual energy consumption.
Current Transformer Calibration Methods
Accurate current transformer calibration forms the foundation of reliable energy monitoring systems, requiring precise adjustments to guarantee your Arduino-based measurements reflect true electrical consumption.
You’ll need to establish proper calibration values for your CT sensors to achieve dependable readings. For a standard 100-amp CT, you’ll typically use a calibration factor of 0.32, though this may vary based on your specific hardware configuration.
Follow these essential calibration steps:
- Determine zero values by recording maximum and minimum current readings without load.
- Calculate RMS current using the formula: (maxCurrent – zero) × calibration.
- Verify accuracy by comparing your Arduino readings against a reliable multimeter.
Once calibrated, you can calculate real-time power using: Volts × RMSCurrent, with standard residential voltage around 121.2 volts ensuring consistent measurements throughout your monitoring system.
RMS Power Calculation Process
| Parameter | Phase 1 | Phase 2 |
|---|---|---|
| Peak Current | Tracked | Tracked |
| RMS Current | Calculated | Calculated |
| RMS Power | V × I | V × I |
You’ll sum both phases’ RMS power values for total consumption, then calculate kilowatt-hours using total RMS power and time measurements in milliseconds.
RMS Calculations for Precise Energy Readings
When monitoring electrical energy with Arduino-based systems, RMS calculations form the foundation of accurate power measurements.
You’ll need to implement specific formulas to convert raw sensor data into meaningful electrical readings.
Your RMS current calculation follows this process:
- Current Conversion: Calculate RMS current using (maxCurrent – zero) * calibration, where your 100 amp CT uses a 0.32 calibration value.
- Phase Power Calculation: Multiply your 121.2-volt reading by the RMS current to determine individual phase power consumption.
- Total Power Summation: Add both phase readings together for thorough energy monitoring across your split-phase 120/240 service.
You’ll then calculate kilowatt-hours by factoring in the measured power and usage duration in milliseconds.
This precision guarantees your Arduino energy monitor delivers reliable, real-world amperage conversions for effective home energy management.
Kilowatt-Hour Tracking and Daily Reset Automation
Beyond converting raw sensor data into power readings, your Arduino energy monitor must accumulate these measurements over time to provide meaningful consumption insights.
Your system tracks kilowatt-hours by calculating the product of RMS power readings and time duration, measured in milliseconds for maximum precision. This continuous accumulation creates a running total of your energy consumption throughout each day.
To maintain accurate daily tracking, your monitor automatically resets the kilowatt-hour counters at 23:59 each night, giving you fresh daily energy data.
You’ll see these kilowatt-hour totals displayed in real-time through both the Blynk app and serial monitor, alongside current and power metrics. This automated reset functionality guarantees you can easily compare daily consumption patterns and identify energy usage trends.
OLED Display Integration for Live Data Visualization
While collecting energy data provides valuable insights, visualizing this information locally transforms your Arduino energy monitor into a thorough dashboard.
The SSD1306 OLED display connects via I2C, making integration straightforward while providing real-time visualization of your energy metrics.
The I2C interface simplifies OLED integration, delivering instant visual feedback for comprehensive energy monitoring and analysis.
You’ll need the Adafruit GFX and Adafruit SSD1306 libraries to render graphics and text effectively. Your code retrieves current readings, power usage, and kilowatt-hour calculations, formatting them for clear display.
The OLED screen enables you to:
- Monitor instantaneous readings – View live voltage, current, and power consumption
- Confirm calibration accuracy – Visually verify voltage sensor adjustments during setup
- Track energy patterns – Observe consumption trends throughout the day
This real-time feedback empowers better energy management decisions.
Blynk App Connectivity for Remote Monitoring
Although local OLED displays provide immediate feedback, remote monitoring through the Blynk app extends your energy monitor’s capabilities far beyond physical proximity.
You’ll connect your Arduino to Blynk using a specific token and IP address, enabling real-time data access from anywhere. The virtualWrite function sends current readings, power metrics, and kilowatt-hour data directly to your app interface.
Your system automatically syncs time updates every 10 minutes, ensuring accurate timestamps for all energy usage data.
The Blynk dashboard displays current readings in amperes for both phases and power consumption in watts, giving you thorough energy insights.
Serial prints complement your app data, letting you verify readings through both the Blynk interface and Arduino’s serial monitor simultaneously for enhanced monitoring reliability.
Serial Communication and Data Logging Methods
Serial communication forms the backbone of your energy monitor’s data handling capabilities, operating at 115200 baud to deliver rapid, real-time transmission between your Arduino and connected devices.
You’ll access detailed energy metrics directly through the serial monitor, watching current, power, and kilowatt-hour readings update continuously.
Your system maintains data accuracy through three key processes:
- Millisecond-precision timing – Power calculations use exact time measurements for reliable consumption analysis.
- 10-minute synchronized updates – Regular data refreshes keep your logged information current and actionable.
- Daily counter resets at 23:59 – Automatic kilowatt-hour clearance guarantees accurate daily energy tracking.
This logging method works alongside Blynk’s virtualWrite commands, creating dual data streams that keep you informed whether you’re monitoring locally or remotely.
Circuit Assembly and Wiring Guidelines
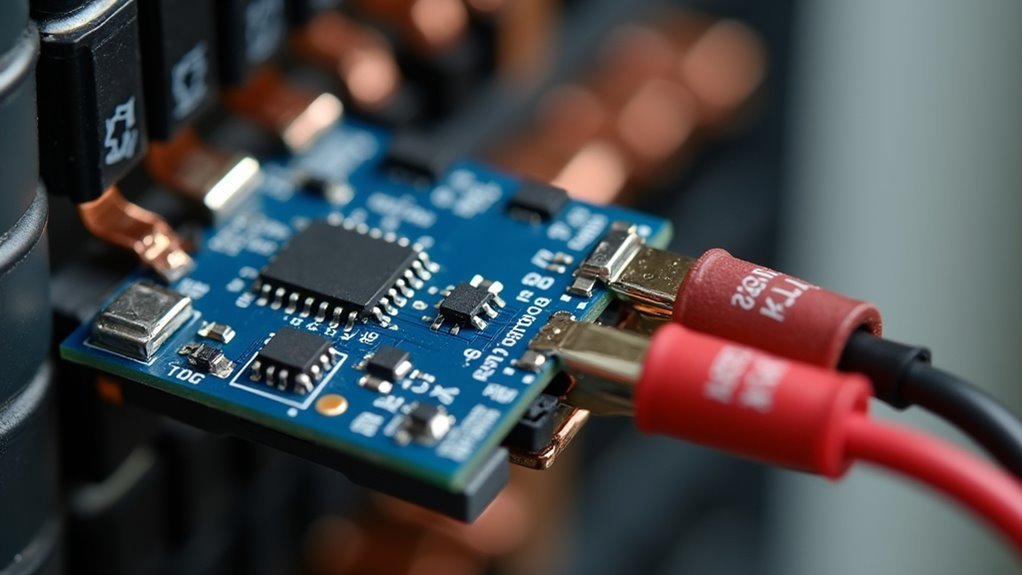
Building your energy monitor requires precise connections between multiple sensors and your Arduino, with each component serving a critical role in accurate power measurement.
Connect the ZMPT101B’s VCC and ground pins to your Arduino’s 5V and ground respectively, then wire its output to analog pin A0. For the current sensor, you’ll need an external power supply for VCC while connecting the output to analog pin A1.
Wire your SSD1306 OLED display to the Arduino’s 3.3V, ground, SCL, and SDA pins for real-time data visualization.
Don’t forget calibration—adjust the ZMPT101B’s potentiometer and verify readings against a multimeter to guarantee measurement accuracy throughout your project’s operation.
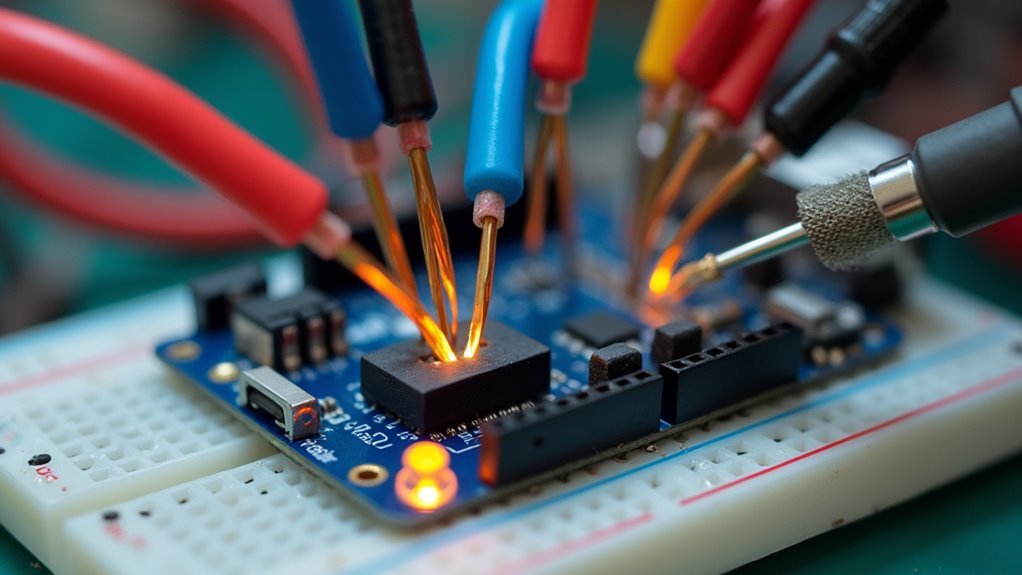
Sensor Calibration and Testing Procedures
Once you’ve completed the wiring, your sensors won’t provide accurate readings without proper calibration—a critical step that transforms raw sensor output into reliable power measurements.
Proper sensor calibration is the cornerstone of transforming unreliable raw data into precise, actionable power measurements for your monitoring system.
You’ll notice initial sensor values display as zero before connections are made, which is normal.
Here’s your calibration approach:
- Voltage sensor adjustment – Use the ZMPT101B’s built-in potentiometer to fine-tune voltage readings.
- Current sensor programming – Adjust the CD clamp current sensor through code modifications rather than hardware adjustments.
- Validation testing – Compare your Arduino’s readings against an MPM meter or multimeter to verify accuracy.
Test with various appliances like room coolers to guarantee consistent performance.
When your readings closely align with actual multimeter values, you’ve successfully calibrated your energy monitoring system for reliable long-term operation.
Practical Applications and Energy Efficiency Benefits
Why should you invest time building an Arduino energy monitor when commercial options exist?
You’ll gain precise control over your home’s energy tracking while saving money. Your custom system accurately measures voltage, current, and power across both phases of split-phase service using calibrated current transformers.
You’ll identify energy-hungry appliances instantly and track consumption patterns through real-time Blynk app connectivity.
Daily kilowatt hour resets let you monitor usage trends and spot savings opportunities quickly. Your system protects sensitive electronics by detecting voltage irregularities that could cause damage.
Unlike expensive commercial alternatives, you’ll customize features to match your specific needs while understanding exactly how your energy monitoring works. This hands-on approach delivers both knowledge and practical energy management capabilities.
Frequently Asked Questions
Can Arduino Energy Monitors Work With Solar Panels and Battery Storage Systems?
You can integrate energy monitors with solar panels and battery systems by measuring DC voltage, current, and power flows. You’ll need appropriate sensors and voltage dividers to safely monitor your renewable energy production and storage.
What’s the Typical Lifespan of Arduino Energy Monitoring Components Before Replacement Needed?
You’ll typically get 3-5 years from sensors and displays, while the Arduino board itself can last 5-10 years. You’ll need to replace components based on environmental exposure and usage intensity.
Are There Any Safety Certifications Required for Homemade Arduino Energy Monitors?
You’ll need UL or ETL certification if you’re selling commercial units, but homemade monitors for personal use don’t require certifications. However, you should follow electrical codes and safety standards to prevent fires or electrocution.
How Do Extreme Temperatures Affect Arduino Energy Monitor Accuracy and Performance?
Extreme temperatures reduce your Arduino’s accuracy by affecting sensor calibration and component resistance. You’ll notice drift in readings below 32°F or above 85°F, plus potential LCD display failures and shortened battery life.
Can Multiple Arduino Energy Monitors Communicate Together for Whole-House Zone Monitoring?
You can network multiple Arduino energy monitors using WiFi, Zigbee, or wired protocols like RS485. They’ll share data through MQTT brokers or mesh networks, enabling extensive whole-house monitoring across different zones and circuits.


Leave a Reply