
You’re managing multiple smart home devices, but your current dashboard feels cluttered and inefficient. Whether you’re monitoring energy usage, security systems, or climate control, a poorly designed interface can leave you scrambling to find critical information when you need it most. The difference between a functional dashboard and an exceptional one lies in five strategic approaches that’ll transform how you interact with your home automation system.
Choose the Right Data Visualization Types for Your Smart Home Metrics
How effectively you visualize your smart home data directly impacts your ability to make informed decisions about energy usage, device performance, and overall system efficiency.
Effective smart home data visualization is the foundation for making strategic decisions about energy efficiency and system optimization.
When you create a widget for your custom dashboard, selecting appropriate types of widgets becomes essential for meaningful data presentation.
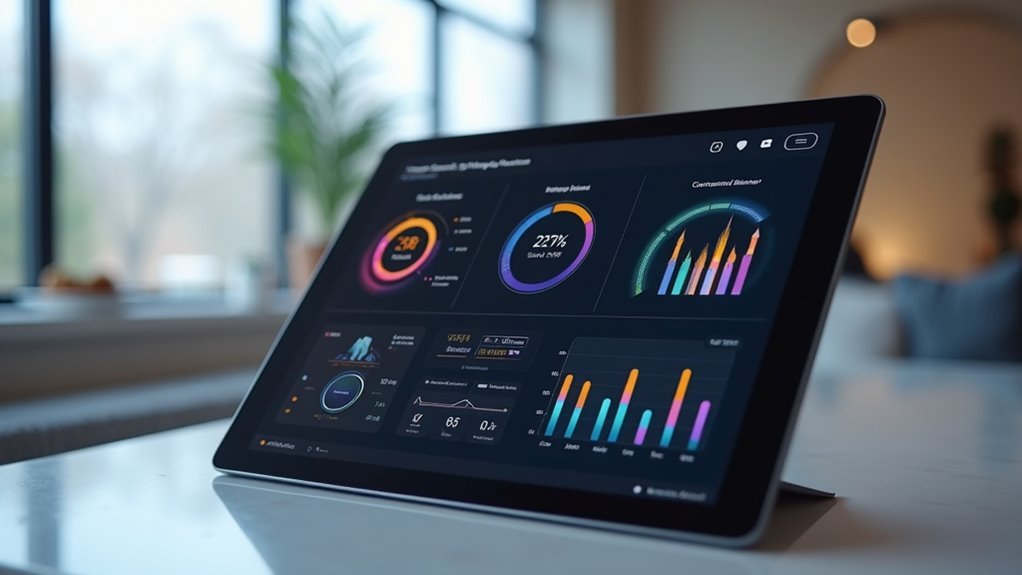
For tracking energy consumption trends, line charts display your data most effectively over time. To monitor device statuses, pie charts clearly show active versus inactive devices.
When comparing device performance, you’ll want to create and add a bar chart for straightforward analysis. Gauge charts work perfectly for displaying current thermostat settings, while number cards provide quick summaries of key metrics like total energy savings.
Understanding these visualization options helps you add widgets that transform raw data into actionable insights.
Organize Widget Layout for Optimal Home Automation Monitoring
Once you’ve selected the right visualization types, strategic widget placement becomes essential for efficient home automation monitoring.
When you create a custom widget for your dashboard, logical organization dramatically improves usability for users in your organization.
Here’s how to enhance your layout:
- Group by functionality – Arrange security, energy management, and environmental controls together for intuitive navigation
- Apply smart filters – Display only relevant devices like smart lights and thermostats to reduce dashboard clutter
- Prioritize critical metrics – Place real-time status updates and alerts in prominent positions for immediate visibility
- Maintain relevance – Regularly update and hide outdated custom widgets to keep your dashboard efficient
When you add to a dashboard, consider user workflows and frequency of interaction to determine the best widget positioning.
Implement Real-Time Data Refresh Settings for Device Status Updates

While visual organization sets the foundation for effective dashboards, implementing robust real-time data refresh settings guarantees your custom widgets display the most current device status information. You’ll want to create refresh configurations that automatically update every 24 hours while providing manual refresh options through your settings menu.
| Refresh Type | Update Frequency | Best For |
|---|---|---|
| Automatic | Every 24 hours | Routine monitoring |
| Manual | On-demand | Critical status checks |
| Simultaneous | All widgets sync | Multi-device tracking |
The refresh button includes a countdown timer, showing when the next auto-refresh occurs. This allows you to monitor device status effectively using cached data immediately upon opening dashboards. You’ll enhance efficiency by configuring widgets to refresh simultaneously, eliminating individual updates while maintaining accurate data source connections for peak device monitoring.
Configure Custom Filters to Display Priority Home Systems
Why settle for cluttered dashboards when custom filters can spotlight your most critical home systems?
You’ll streamline your workflow by implementing targeted filtering that displays only what matters most to your operations.
When you create a dashboard, add custom filters that focus on priority home systems through these essential steps:
- Access the custom filter creation section within dashboard settings to define organizational criteria
- Utilize user-defined fields to segment devices by activation status or operating system version
- Apply filters targeting specific attributes like unactivated Windows OS devices
- Save your custom filter for easy access and future updates
Select any widget from the Widget library that supports your filtered data.
Incorporate complementary visualizations such as bar charts or tables to display priority systems effectively, ensuring your dashboard remains actionable and current.
Design Interactive Elements for Dynamic Control Panel Navigation

Beyond static filtering, you’ll amplify your dashboard’s functionality by building interactive elements that respond to user input in real-time. When creating custom dashboards, incorporate dropdown menus in your new widget to let users filter data dynamically. Click Add to Dashboard after configuring clickable buttons that trigger specific actions like running jobs or accessing detailed reports.
| Element Type | Function | User Benefit |
|---|---|---|
| Dropdown Menus | Filter data by criteria | Dynamic customization |
| Clickable Buttons | Trigger actions/navigation | Instant functionality access |
| Hover Tooltips | Display contextual info | Enhanced understanding |
| Toggle Switches | Enable/disable views | Real-time customization |
Design hover-over tooltips for additional context without cluttering your interface. Implement toggle switches in interactive elements to customize data views. If needed, you can easily remove the widget and rebuild. Verify all creating custom elements maintain intuitive, consistent design patterns for seamless navigation.
Frequently Asked Questions
How to Develop a Widget Dashboard?
You’ll access the Widget Library to select visualization types like bar or line charts. Choose single attributes for display, utilize user-defined fields for current data, save custom widgets, and regularly refresh configurations.
How to Build a Custom Widget?
You’ll access the widget library and click “Create widget” in the top-right corner. Provide a title and description, select one attribute from your schema, choose visualization type, then save to dashboard.
How to Create a Dashboard in GHL?
Navigate to GHL’s “Dashboards” section and click “Create Dashboard.” Name your dashboard descriptively, add widgets using “Add Widget,” customize with relevant data sources and metrics, then save and share with your team.
How Do I Add Widgets to My Servicenow Dashboard?
Navigate to your dashboard and click “Edit” to enter editing mode. Select “Add Widget” to access the library, choose your desired widget, configure its settings including data sources, then save your changes.
Leave a Reply