You’re breathing indoor air that’s potentially 2-5 times more polluted than outdoor air, yet you probably don’t know what’s floating around your home right now. Your smart home can track temperature and humidity, but what about the invisible volatile organic compounds seeping from furniture or the carbon monoxide from that gas appliance? Building an ESP32-based air quality monitor transforms your living space into an intelligent health guardian that’ll reveal exactly what you’ve been unknowingly inhaling.
Understanding Indoor Air Pollution and Health Risks
While you might assume outdoor air poses the greatest pollution threat, your indoor environment often harbors considerably more dangerous contaminants.
Volatile organic compounds from furniture and cleaning products can reach concentrations ten times higher than outdoor levels. You’ll experience health consequences including headaches, fatigue, and reduced cognitive performance when exposed to poor indoor air quality.
Indoor air pollution can be ten times worse than outdoor levels, causing headaches, fatigue, and impaired thinking.
Inadequate ventilation increases carbon monoxide levels, while regular exposure to particulate matter (PM2.5) contributes to respiratory and cardiovascular diseases.
These invisible pollutants accumulate without warning signs, making detection challenging without proper equipment.
An indoor air quality monitor becomes essential for identifying these threats before they impact your health.
Real-time monitoring enables proactive measures, helping you maintain safer living spaces through immediate awareness of pollution levels.
Essential Components and Hardware Selection
You’ll need to carefully select three critical hardware categories to build an effective ESP32 air quality monitor: core sensor technologies for measuring pollutants, the right microcontroller platform for processing and connectivity, and reliable power management solutions.
Your sensor choices will determine what air quality parameters you can track, while the ESP32 DEVKIT V1 provides the WiFi capabilities essential for data transmission and remote monitoring.
The power system you implement must sustain continuous operation of both the microcontroller and multiple sensors without compromising measurement accuracy.
Core Sensor Technologies
The foundation of any effective ESP32 air quality monitor lies in selecting the right combination of sensors that can accurately measure the key pollutants and environmental factors affecting your indoor and outdoor spaces.
These core sensor technologies work together to provide thorough environmental monitoring capabilities.
When building your ESP32 air quality monitor, you’ll need these essential sensors:
- ScioSenses ENS160 – Measures TVOCs, carbon monoxide, and AQI with response times under one minute
- Nova SDS011 – Detects PM2.5 and PM10 particulate matter levels effectively
- MH-Z19 – Provides reliable CO2 measurements for indoor air quality assessment
- AHT20 or DHT11 – Monitors temperature and humidity with high accuracy
These core sensor technologies integrate seamlessly with your ESP32 microcontroller, enabling real-time data analysis and smart home compatibility.
Microcontroller Platform Choice
Choosing the right microcontroller platform sets the foundation for your air quality monitor’s performance and capabilities. The ESP32-S3 MCU stands out as the best choice for air quality monitoring applications. You’ll benefit from its dual-core processing power, built-in Wi-Fi and Bluetooth connectivity, and extensive GPIO pins for sensor integration. The ESP32’s wireless capabilities enable seamless data transmission to cloud services and smart home systems without additional hardware.
| Feature | ESP32-S3 | Alternative MCUs |
|---|---|---|
| Connectivity | Wi-Fi + Bluetooth | Limited/None |
| Processing | Dual-core 240MHz | Single-core variants |
| Power Efficiency | Advanced sleep modes | Basic power management |
| Sensor Support | Multiple I2C/SPI/UART | Fewer interfaces |
The platform’s low power consumption extends battery life while maintaining reliable sensor data collection and wireless communication.
Power Management Solutions
Power efficiency determines your air quality monitor’s operational lifespan and deployment flexibility. Your ESP32-based device requires strategic power management solutions to maximize battery life while maintaining accurate air quality monitor measuring capabilities.
Essential power optimization strategies include:
- Deep Sleep Mode Implementation – Configure your ESP32’s built-in deep sleep functionality to dramatically reduce power consumption during inactive periods.
- 3.7V 1000 mAh LiPo Battery Integration – Select this compact, efficient power source for extended operation cycles.
- DC/DC Step-Up Converter Addition – Install voltage regulation to guarantee stable sensor power without excessive battery drain.
- Modem-Sleep Feature Activation – Enable Wi-Fi power reduction during connectivity downtime to conserve energy.
Custom PCB design further enhances efficiency by optimizing power routing and minimizing energy loss through improved connections.
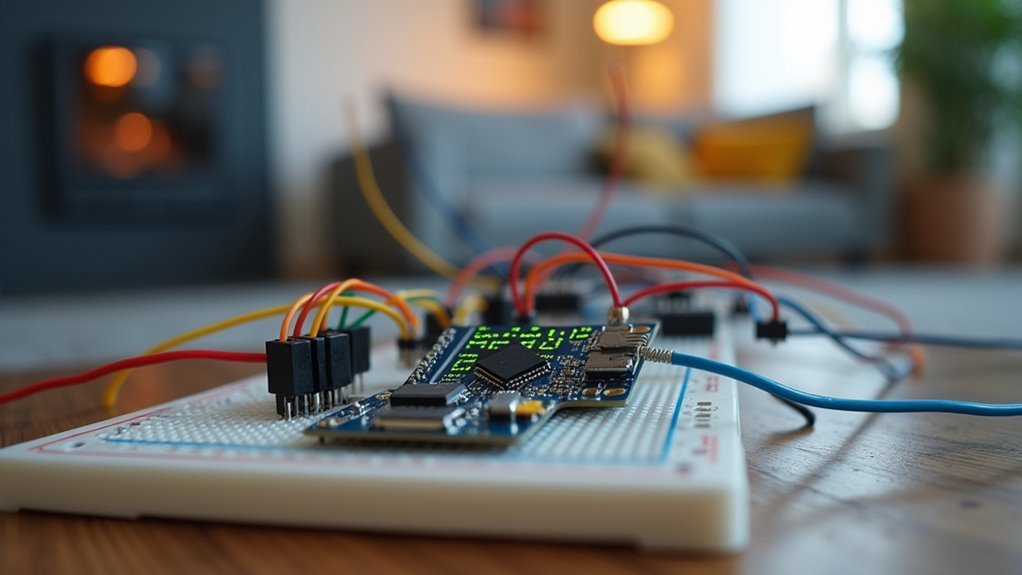
ESP32 Microcontroller Setup and Configuration
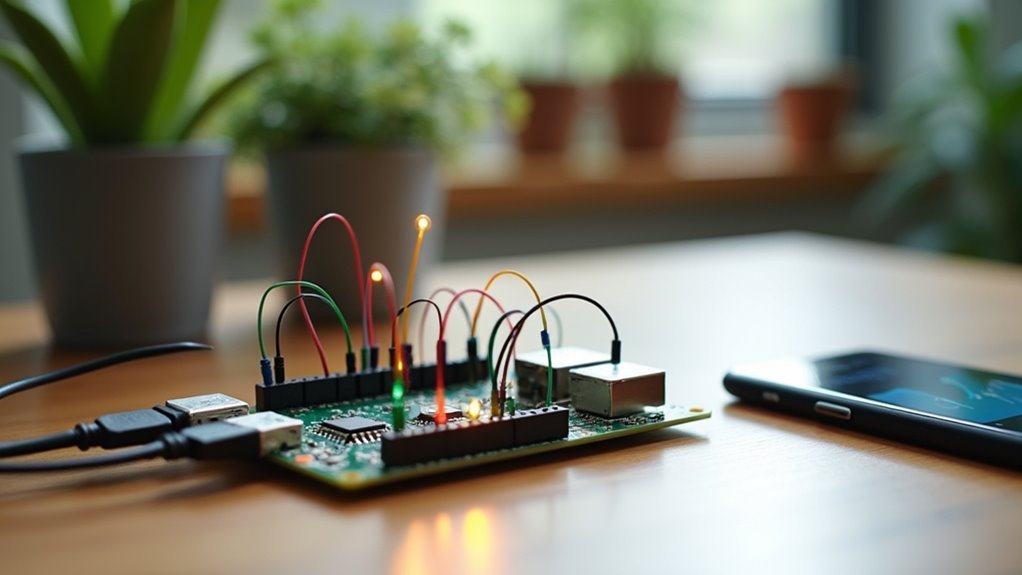
You’ll need to establish proper hardware connections between your ESP32 and air quality sensors before configuring the software components.
Setting up WiFi connectivity requires entering your network credentials and establishing a stable connection for data transmission.
Once connected, you’ll calibrate each sensor to guarantee accurate readings from your air quality monitoring system.
Hardware Connection Essentials
When building an effective air quality monitor, the ESP32 microcontroller forms the backbone of your entire system, providing both processing power and wireless connectivity for real-time data transmission.
Understanding hardware connection essentials guarantees your sensors communicate properly with the ESP32.
Here are the critical hardware connection essentials:
- GPIO Pin Assignment – Connect SDS011 and MH-Z19 sensors to appropriate GPIO pins, guaranteeing proper data, power, and ground connections for reliable communication.
- Power Supply Management – Use a 3V7 LiPo battery with DC/DC step-up converter to maintain stable voltage across your ESP32 and connected sensors.
- Library Integration – Install Nova SDS011 and MH-Z19 libraries in Arduino IDE for seamless sensor data acquisition.
- OTA Configuration – Enable over-the-air updates for wireless firmware uploads without physical device access.
WiFi Network Configuration
Although your ESP32’s hardware connections provide the foundation for sensor communication, establishing a reliable WiFi network configuration guarantees your air quality data reaches its intended destination.
Begin by including the `WiFi.h` library in your code, then use `WiFi.begin(ssid, password)` to connect to your desired network. The ESP32 supports both WPA/WPA2 security protocols, ensuring secure data transmission.
You’ll want to implement error handling using `WiFi.status()` to check connection states and troubleshoot issues effectively. Configure your ESP32 as either a soft Access Point or WiFi station, depending on your smart home setup requirements.
The dual-core architecture enables simultaneous WiFi operations while collecting sensor data, optimizing your system’s performance.
Sensor Calibration Process
Once your ESP32 connects to WiFi successfully, proper sensor calibration becomes your next priority to verify accurate air quality measurements.
The sensor calibration process ascertains your monitoring system delivers reliable data for smart home applications.
Here’s your essential sensor calibration process:
- Enable auto-calibration for NDIR sensors like the SenseAir S8/S88 CO sensor, which requires weekly automatic calibration cycles to maintain accuracy.
- Validate readings against known reference values or nearby certified sensors to establish baseline accuracy for your measurements.
- Implement error handling in your firmware’s data acquisition loop to manage sensor read failures and inconsistent values.
- Schedule regular recalibration intervals based on manufacturer specifications to account for sensor drift over time.
Proper calibration prevents inaccurate data logging in platforms like InfluxDB.
Sensor Integration: PM2.5, CO2, and VOC Detection
The foundation of any effective air quality monitoring system lies in selecting the right combination of sensors that can detect the most common indoor pollutants.
Your ESP32-based monitor achieves extensive coverage through strategic sensor integration of three critical components. The Nova SDS011 sensor accurately measures PM2.5 and PM10 particulate matter, capturing airborne pollutants that directly impact respiratory health.
You’ll rely on the MH-Z19 sensor for precise CO2 detection, ensuring you can assess indoor ventilation adequacy. The ENS160 sensor rounds out your monitoring capabilities by detecting total volatile organic compounds and carbon monoxide from household products and cooking activities.
Your ESP32 microcontroller processes this multi-sensor data stream, enabling real-time transmission to InfluxDB for extensive logging, analysis, and proactive air quality management in your smart home environment.
PCB Design and Circuit Assembly

You’ll need to carefully select and position components like the SDS011 sensor and BME680 on your PCB to create a compact, efficient layout that aligns with your case openings.
Proper soldering techniques become essential when attaching these components, especially when installing the female header for your ESP32 module to guarantee easy maintenance access.
Once assembly’s complete, you’ll want to systematically test each circuit section and troubleshoot any issues before finalizing your air quality monitor.
Component Selection and Layout
When designing your ESP32 air quality monitor’s PCB, component selection and strategic layout form the foundation of reliable sensor performance. Your component selection directly impacts measurement accuracy and system stability.
Here’s your essential component selection and layout strategy:
- Position sensors strategically – Place the SDS011 particulate sensor with proper airflow consideration, ensuring clear inlet and outlet pathways for accurate readings.
- Include decoupling capacitors – Add these near power pins to stabilize voltage supply and reduce electrical noise that could interfere with sensor measurements.
- Use female headers for ESP32 – This allows easy replacement and maintenance without desoldering, extending your device’s lifespan.
- Incorporate solder jumpers – These provide configuration flexibility, letting you modify settings without redesigning the entire board.
Soldering Techniques and Tips
Five critical soldering techniques will determine whether your ESP32 air quality monitor functions reliably or fails intermittently.
Start by cleaning all PCB pads thoroughly to remove oxidation, guaranteeing ideal adhesion and conductivity. You’ll need a fine-tip soldering iron for precision work with the ESP32 and sensor components.
Apply heat simultaneously to both the component lead and pad, then introduce solder to create natural flow without over-soldering.
Hold your iron at a 45-degree angle and avoid movement while the joint cools to maintain integrity.
Keep solder wick handy to remove excess material and fix cold joints that could cause short circuits.
These fundamental soldering techniques guarantee your air quality monitor delivers consistent, accurate readings throughout its operational life.
Testing and Troubleshooting
After completing your soldering work, systematic testing becomes your next priority to verify circuit functionality.
You’ll need to methodically check each connection and sensor to guarantee your ESP32 air quality monitor operates correctly.
Essential Testing and Troubleshooting Steps:
- Power Supply Verification – Check voltage levels across all components using a multimeter to confirm proper power distribution and decoupling capacitor effectiveness.
- Sensor Connection Testing – Verify each sensor’s wiring, particularly the SDS011’s data lines, to prevent failed readings or erroneous output data.
- Serial Monitor Analysis – Use Arduino IDE’s serial monitor to observe sensor data streams and identify communication issues during initial testing phases.
- OTA Update Implementation – Configure over-the-air firmware updates for remote troubleshooting capabilities, enabling software fixes without physical device access for ongoing maintenance.
Case Development and 3D Printing Requirements
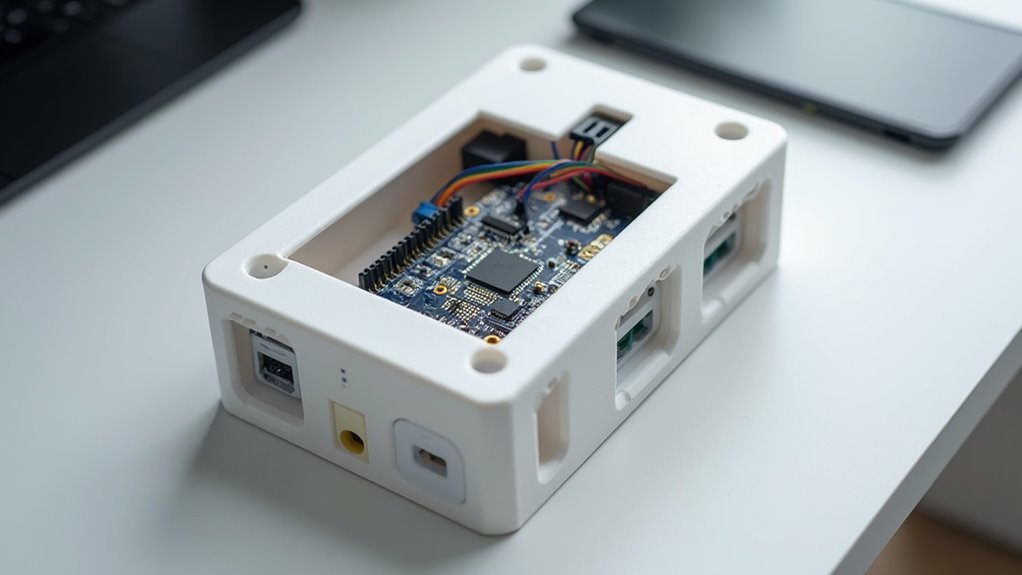
Since you’ve assembled the core electronics and verified the sensor functionality, you’ll need a protective housing that accommodates proper airflow while keeping your components organized.
Using a 3D CAD program, you’ll design a case with strategically positioned air inlet and outlet openings that align with your SDS011 sensor requirements. 3D printing enables rapid prototyping, allowing you to make quick adjustments as needed.
Strategic CAD design with optimized airflow openings ensures your SDS011 sensor operates effectively while enabling rapid prototyping iterations.
Your design should incorporate a 5V cooling fan to prevent electronics overheating during extended operation. Create specific openings that guarantee proper airflow for accurate particulate matter readings.
Replace those initial jumper wires with a custom PCB design—this’ll make your assembly more organized and space-efficient within the printed case. The 3D printing process lets you accommodate different components while enhancing overall monitor functionality.
Programming the Air Quality Monitoring System
With your custom case protecting the electronics, you’ll need to program the ESP32 to collect, process, and transmit air quality data effectively.
Programming the air quality monitoring system requires careful attention to sensor initialization, data handling, and connectivity management to guarantee reliable operation.
Your code should include these essential components:
- Sensor initialization loops for real-time PM2.5, CO2, and VOC monitoring with customizable reading intervals
- Error handling mechanisms that log failed sensor readings and transmission attempts for reliable performance
- SPIFFS implementation for local data storage when WiFi connectivity is unavailable, maintaining data persistence
- Over-the-Air (OTA) update functionality enabling remote software updates without physical device access
The Arduino IDE provides the flexibility you need to customize sensor readings and data transmission intervals according to your specific monitoring requirements.
WiFi Connectivity and Data Transmission
Once your ESP32’s programming foundation is established, you’ll need to configure WiFi connectivity to facilitate seamless data transmission from your air quality sensors to cloud platforms.
The ESP32’s built-in WiFi capabilities make this process straightforward through the Arduino IDE. You can operate your device in station mode to connect to existing networks or soft-AP mode to create local networks for data sharing.
Using HTTP libraries, you’ll transmit sensor data from PM2.5, CO2, and VOC sensors to cloud databases like InfluxDB at regular intervals, typically every second. This guarantees continuous monitoring and real-time alerts for air quality changes.
Additionally, implementing OTA updates allows you to upgrade firmware remotely, keeping your monitor current with the latest features and bug fixes.
InfluxDB Database Setup and Configuration
After establishing WiFi connectivity for your ESP32 air quality monitor, you’ll need to configure InfluxDB as your time-series database to store and manage the incoming sensor data efficiently.
Setting up InfluxDB requires several essential steps:
Proper InfluxDB configuration involves multiple critical steps that must be completed sequentially for successful ESP32 integration.
- Install and Launch InfluxDB – Install InfluxDB on your server or local machine, then verify it’s running by accessing the web interface at `http://localhost:8086`.
- Create Your Database – Execute `CREATE DATABASE air_quality` through the InfluxDB command line interface or web UI to establish your data storage location.
- Configure ESP32 Connection – Include the InfluxDB library in your ESP32 code and set database parameters including name, credentials, and server IP address.
- Implement Data Transmission – Use the HTTP API to send sensor readings in line protocol format with measurements, tags, fields, and timestamps.
Real-Time Dashboard Creation With Grafana
You’ll need to connect Grafana to your InfluxDB database as the primary data source to access your ESP32 sensor readings.
Once connected, you can create custom panels that display real-time visualizations of your air quality metrics using various chart types and gauges.
Setting up alert thresholds within these panels guarantees you’re notified immediately when air quality levels become concerning.
InfluxDB Data Source Setup
Before your ESP32 can stream air quality data to Grafana’s impressive visualization engine, you’ll need to establish InfluxDB as the critical bridge between your hardware and dashboard.
This time-series database excels at handling sensor data efficiently.
Here’s how to configure your InfluxDB data source:
- Install and start InfluxDB on your server or local machine, ensuring it’s configured to accept HTTP API requests from your ESP32 device.
- Create a dedicated database using the command `CREATE DATABASE air_quality` in InfluxDB’s command line interface for organized data storage.
- Program your ESP32 to send HTTP POST requests containing PM2.5, CO2, temperature, and humidity readings using proper line protocol formatting.
- Connect Grafana to InfluxDB by adding the data source with your database name, server URL, and authentication credentials.
Custom Panel Configuration
With your InfluxDB connection established, creating custom panels transforms raw sensor data into actionable insights. You’ll configure distinct panels for each air quality metric, enabling thorough monitoring of your indoor environment.
Start by adding a new panel and selecting your InfluxDB data source. Configure each panel to display specific metrics using Grafana’s query editor. You can filter data by time ranges and aggregate values for trend analysis.
| Metric | Panel Type | Unit |
|---|---|---|
| PM2.5 | Graph | µg/m³ |
| CO2 | Gauge | ppm |
| Temperature | Stat | °C |
| Humidity | Graph | % |
| TVOCs | Bar Gauge | ppb |
Custom panels allow you to set visualization preferences, color schemes, and thresholds. You’ll create an intuitive dashboard that displays real-time air quality data, making it easy to identify pollution patterns and maintain healthy indoor conditions.
Alert Threshold Management
Setting effective alert thresholds guarantees your air quality monitoring system actively protects your health rather than passively collecting data.
You’ll configure these critical boundaries in Grafana to receive immediate notifications when dangerous conditions arise.
Your alert thresholds should align with established air quality standards:
- PM2.5 levels – Set warnings at 35 μg/m³ and critical alerts at 55 μg/m³ for particle matter detection.
- CO2 concentrations – Configure notifications at 1000 ppm for poor ventilation and 1500 ppm for immediate action.
- VOC readings – Establish thresholds based on your specific sensors’ calibration and manufacturer recommendations.
- Response timing – Define alert frequencies to prevent notification spam while ensuring rapid response capabilities.
You’ll customize notification channels including email, SMS, or mobile apps, ensuring you’re promptly informed when air quality deteriorates beyond acceptable limits.
Home Assistant Integration and Automation
Once you’ve built your ESP32 air quality monitor, you’ll want to integrate it with Home Assistant to access powerful automation capabilities and centralized control.
ESPHome or Tasmota firmware makes this integration straightforward, providing real-time data visualization from a single dashboard.
You can configure automated responses when pollutant levels exceed your predefined thresholds. For example, automatically trigger air purifiers when PM2.5 readings spike, or activate ventilation systems when CO2 concentrations rise.
Home Assistant supports multiple sensor types including VOC monitors for extensive coverage.
Set up instant notifications to receive alerts on air quality changes, ensuring you respond quickly to potential health risks.
The platform also logs historical data, letting you analyze trends over time and make informed decisions about your indoor environment management strategies.
Power Management and Battery Optimization
Building a reliable air quality monitoring system requires careful attention to power consumption, especially if you want your ESP32 device to run continuously without frequent charging or constant wall power.
Effective power management strategies can dramatically extend your device’s operational lifespan:
- Enable deep sleep mode – Reduce current consumption to just 10 µA between readings, maximizing battery life for weeks or months of operation.
- Implement modem-sleep functionality – Turn off Wi-Fi when not transmitting data, dropping power usage from 160 mA to approximately 20 µA.
- Use Li-ion batteries with TP4056 chargers – Achieve cable-free operation while maintaining efficient battery management for sustainable power supply.
- Optimize firmware wake cycles – Minimize unnecessary processor activity by scheduling measurements only when needed.
Choose low-power sensors like the MH-Z19 CO2 sensor to further enhance overall energy efficiency.
Calibration and Testing Procedures
After you’ve implemented power management features, you’ll need to assure your air quality monitor delivers accurate, reliable readings through proper calibration and testing procedures. You’ll want to compare your sensor readings against known reference values for pollutants like PM2.5 and CO2 to assure measurement accuracy.
| Calibration Task | Frequency |
|---|---|
| Reference value comparison | Every 3 months |
| Controlled environment testing | Quarterly |
| Software routine updates | As needed |
| Performance documentation | After each test |
Establish regular testing intervals every few months to account for sensor drift. Use controlled environments with sealed chambers containing known pollutant concentrations to validate your sensor’s response. Implement automated software-based calibration routines in your firmware for real-time adjustments. Document all calibration results to track performance trends and facilitate troubleshooting.
Troubleshooting and Maintenance Guidelines
While your ESP32 air quality monitor operates reliably most of the time, you’ll inevitably encounter issues that require systematic troubleshooting and regular maintenance.
Effective troubleshooting starts with identifying the root cause of problems rather than treating symptoms. Here’s your essential maintenance checklist:
- Check all connections regularly – Loose wiring between your ESP32 and sensors causes erroneous readings or complete data loss, so inspect connections monthly.
- Implement robust error handling – Add firmware code that manages sensor failures gracefully without crashing your entire system.
- Maintain power system health – Monitor battery voltage and integrate low-battery alerts, as insufficient power affects sensor accuracy considerably.
- Keep sensors clean – Clean SDS011 openings periodically to prevent dust buildup that compromises particulate matter measurements.
Don’t forget to utilize OTA updates for firmware improvements.
Frequently Asked Questions
What Is the Best Indoor Air Quality Monitoring Device?
You’ll find the AirGradient ONE is the best indoor air quality monitor, measuring PM2.5, CO, TVOCs, and NO. It’s award-winning, certified, and offers real-time monitoring with smart home integration for thorough air quality insights.
How Can I Monitor Air Quality in My Home?
You can monitor air quality by installing commercial devices like Purple Air or Awair, using smartphone apps that connect to local monitoring stations, or building your own system with sensors measuring PM2.5, VOCs, and CO levels.
Can Amazon Smart Air Quality Monitor Detect Mold?
You can’t directly detect mold with Amazon’s Smart Air Quality Monitor, but it’ll track humidity and temperature levels that indicate mold-friendly conditions, helping you prevent growth before it starts.
What Are the Iot Sensors for Air Quality Monitoring?
You’ll find various IoT sensors for air quality monitoring including particulate matter sensors like PMS5003, gas sensors such as ENS160 for TVOCs, MH-Z19 for CO2, and environmental sensors like DHT11 for temperature and humidity.

Leave a Reply