You’re breathing indoor air that’s often more polluted than outdoor air, yet you probably don’t know what’s floating around your living space. Building an Arduino-based indoor air quality monitor gives you real-time insights into particulate matter, CO2 levels, and volatile organic compounds that could be affecting your health. With the right sensors and programming approach, you’ll transform raw environmental data into actionable information that reveals exactly what’s in the air you breathe daily.
Understanding Indoor Air Quality Parameters and Health Impacts
Indoor air pollution poses a silent threat that you’re likely breathing right now. Your indoor air quality directly impacts your health through four primary pollutants that demand monitoring.
PM2.5 particles represent the deadliest threat, causing approximately 4.2 million deaths globally each year according to WHO estimates. These microscopic particles penetrate deep into your lungs and bloodstream.
PM2.5 particles kill 4.2 million people annually worldwide, penetrating directly into your lungs and entering your bloodstream undetected.
CO2 levels above 1,000 ppm in poorly ventilated spaces trigger headaches, dizziness, and reduced cognitive function. You’ll notice decreased mental performance before recognizing the cause.
VOCs from household paints and cleaners cause immediate respiratory problems and skin irritation, with certain compounds linked to cancer risks over time.
Ground-level ozone exacerbates existing respiratory conditions even at low concentrations.
Understanding these health effects helps you recognize why monitoring your indoor air quality isn’t optional—it’s essential for protecting your wellbeing.
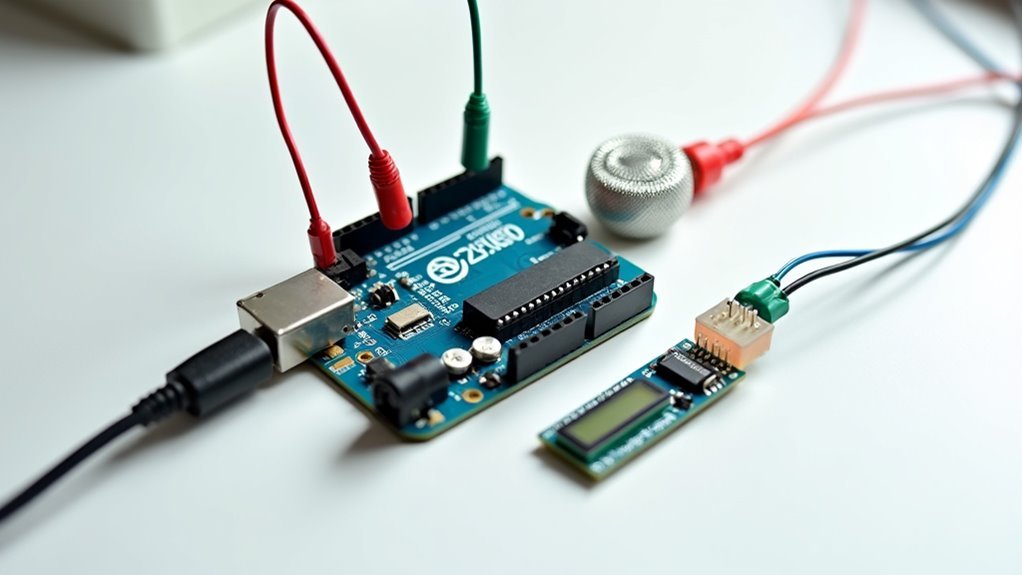
Essential Components and Sensors for Your Arduino Air Quality Monitor
Building an effective Arduino air quality monitor requires selecting the right sensors to detect those harmful pollutants we’ve just explored.
Your core air quality sensors include the PMS5003 for measuring PM2.5 particulate matter, MH-Z19 for CO2 detection, and MQ-131 or MP503 for monitoring ozone and VOCs.
You’ll also need a DHT22 sensor to capture temperature and humidity data, which directly affects air quality readings.
For your Arduino board, use an Arduino Pro Mini to process sensor data efficiently.
The 2.8″ Nextion touch display provides real-time visualization and system interaction.
Don’t forget essential supporting components: a Mini USB power supply, resistors, and jumper wires for proper circuit assembly.
These components guarantee reliable connectivity between your sensors and the Arduino board for accurate monitoring.
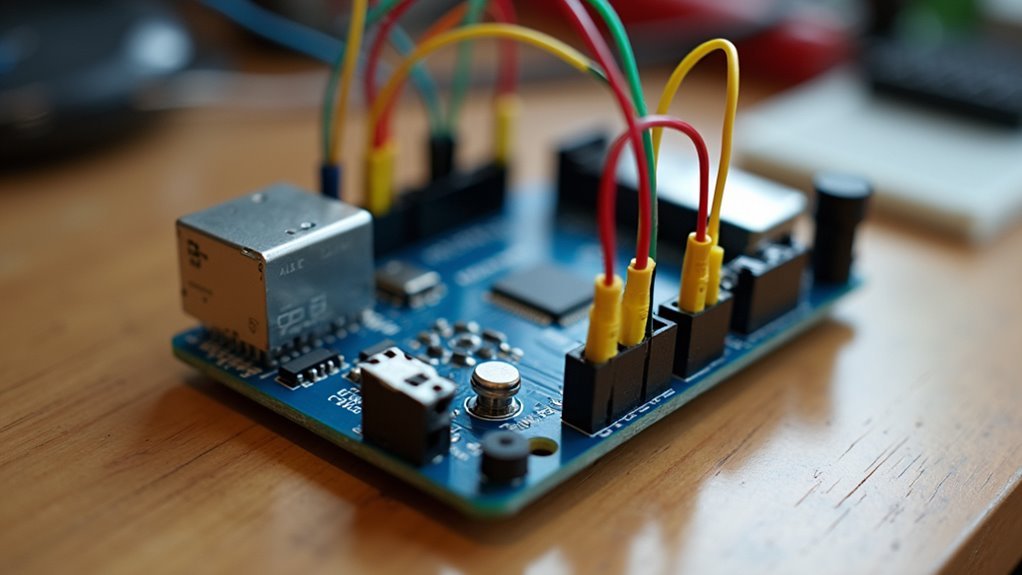
Circuit Design and Wiring Connections for Multiple Sensors
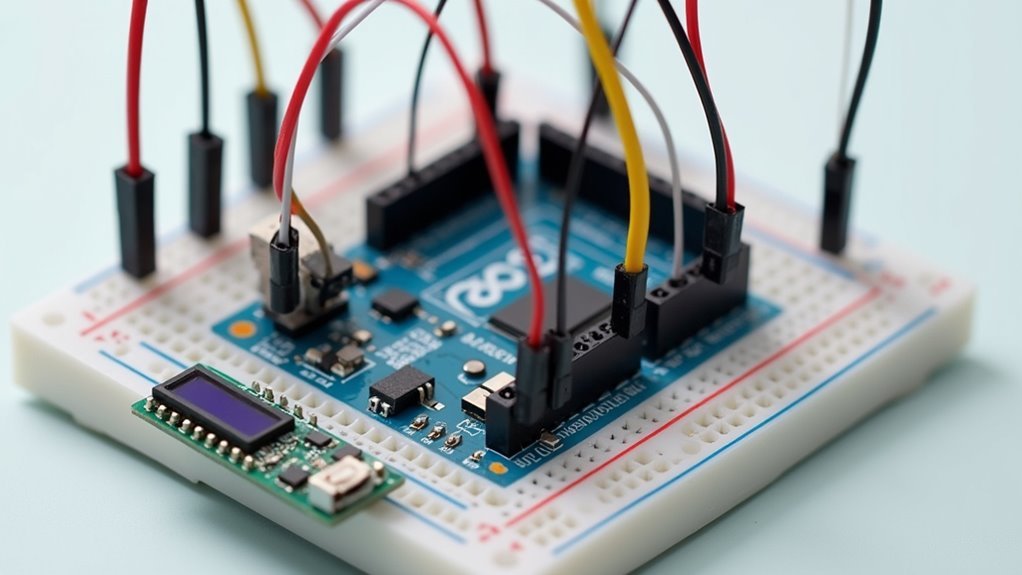
You’ll need to carefully map out your Arduino’s pin configuration to accommodate the PM2.5 sensor’s serial communication, the CO2 sensor’s analog input, and the DHT22’s digital connection.
Each sensor operates on different communication protocols, so you must understand whether they’re sending digital signals, analog voltage readings, or serial data streams.
Once you’ve planned the connections, you’ll solder the components onto a PCB using proper techniques to guarantee reliable electrical contacts and prevent signal interference between sensors.
Arduino Pin Configuration
When designing your Arduino indoor air quality monitor, proper pin configuration forms the foundation of a reliable multi-sensor system. You’ll need to strategically assign each sensor to specific pins based on their communication requirements and data types.
| Sensor | Pin Type | Arduino Pin |
|---|---|---|
| DHT22 (Temp/Humidity) | Digital | D2 |
| MH-Z19 (CO2) | Serial RX/TX | D3/D4 |
| PMS5003 (PM2.5) | Serial Data | D5 |
For analog sensors, you’ll use pins A0-A5 that read variable voltage levels. Digital pin assignments handle binary communications and trigger signals. When connecting serial sensors like the MH-Z19, implement the SoftwareSerial library to designate specific digital pins for RX and TX connections. This approach allows simultaneous communication between multiple sensors without conflicts. Always verify your pin assignments match your code definitions before powering your Arduino system.
Sensor Communication Protocols
Since each sensor in your air quality monitor operates through distinct communication methods, understanding these protocols guarantees reliable data collection across your entire system.
You’ll need to implement different approaches within your Arduino sketch to handle serial and analog communications effectively. Your PM2.5 sensor (PMS5003) and CO2 sensor (MH-Z19) both utilize serial communication protocols, requiring the SoftwareSerial library to manage multiple data streams.
Configure proper baud rates for each sensor to ensure accurate transmission. Meanwhile, your MQ series sensors (MQ-2, MQ-6, MQ-9) communicate through analog signals, connecting directly to analog pins with appropriate resistor configurations.
Essential sensor communication protocols considerations:
- Configure unique SoftwareSerial instances for each serial sensor
- Set correct baud rates (typically 9600 for most sensors)
- Implement proper timing delays between sensor readings
- Use analog reference voltage settings for consistent MQ sensor measurements
PCB Soldering Techniques
Building a reliable circuit requires precise soldering techniques that connect your sensors to the Arduino without introducing electrical faults or signal interference.
Before soldering electronic components onto your air quality monitor’s PCB, clean the pads thoroughly to remove any oxidation that could weaken connections. Select a soldering iron with an appropriately sized tip—fine tips work best for small resistors and sensors.
Practice “tinning” your iron’s tip and component leads beforehand to improve heat transfer and joint reliability. Use tweezers to steady smaller electronic components while positioning them correctly on PCB pads.
Keep your hand steady throughout the process to guarantee precise placement. After completion, inspect each joint carefully for cold solder connections or pad bridges that could cause malfunctions, then verify connections using a multimeter.
Programming the Arduino Pro Mini With Required Libraries
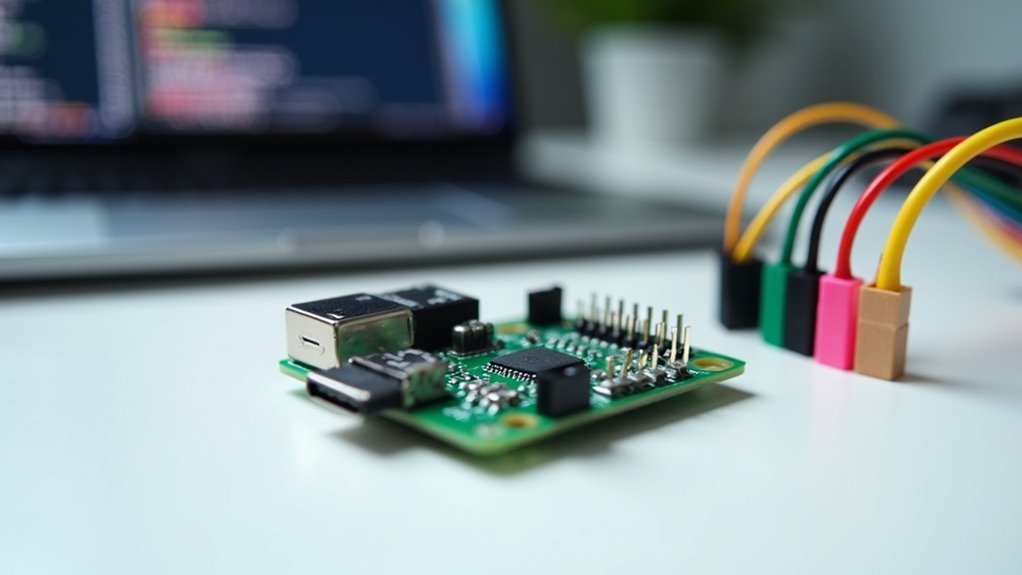
You’ll need to configure your Arduino IDE with the correct board settings and install essential libraries before uploading code to your Pro Mini.
Start by selecting “Arduino Pro or Pro Mini” as your board type and “ATmega328P (5V, 16 MHz)” as your processor in the IDE’s Tools menu.
Install the required libraries including SoftwareSerial, DHT, Adafruit_Sensor, and Adafruit_GFX through the Library Manager to enable communication with your air quality sensors.
Essential Arduino Libraries Setup
Before your Arduino Pro Mini can effectively monitor indoor air quality, you must install and configure several essential libraries that enable seamless communication between the microcontroller and its connected sensors.
These libraries serve as the foundation for your project’s functionality, providing pre-written code that handles complex communication protocols.
You’ll need to install these critical libraries in your Arduino IDE:
- SPI and Wire libraries – Handle communication protocols for your air quality sensor and display components
- Adafruit_GFX and Adafruit_SSD1306 – Control OLED display graphics and text rendering functions
- DHT library – Read temperature and humidity data from the DHT22 environmental sensor
- SoftwareSerial library – Enable multiple serial communications with various connected sensors simultaneously
Configure your board settings to “Arduino Pro or Pro Mini” with ATmega328P processor selection.
Code Upload Configuration
With your libraries properly installed, the next step involves configuring your Arduino IDE to successfully upload code to your Pro Mini board. You’ll need to select the correct board type and processor version through the Tools menu. Navigate to “Arduino Pro or Pro Mini” and choose your specific processor variant.
| Setting | Option | Purpose |
|---|---|---|
| Board | Arduino Pro or Pro Mini | Defines hardware configuration |
| Processor | ATmega328P (3.3V, 8MHz) | Sets clock speed and voltage |
| Port | COM3 (varies by system) | Establishes communication channel |
| Programmer | AVRISP mkII | Defines upload method |
| Bootloader | Arduino/Genuino Uno | Enables code execution |
Connect your USB-to-serial adapter and select the appropriate COM port. Upload your Arduino Code, then open the Serial Monitor to verify successful sensor initialization and view real-time data readings.
Setting Up the Nextion Touch Display for Data Visualization
While the sensors capture critical air quality data, the Nextion touch display transforms this raw information into an intuitive visual interface that you can interact with directly.
You’ll connect the display to your Arduino Pro Mini using serial communication through TX and RX pins, ensuring proper data transfer between components.
Use the Nextion Editor software to design custom screens that showcase your air quality readings effectively.
You’ll create hot spots functioning as navigation buttons, allowing users to switch between different data views seamlessly.
Key setup considerations include:
- Configure matching baud rates in both Arduino code and Nextion display settings
- Design separate screens for PM2.5, CO2, VOC, and temperature data
- Implement dynamic color changes based on air quality thresholds
- Program real-time text field updates for current sensor readings
Calibrating PM2.5, CO2, VOC, and Ozone Sensors for Accurate Readings
You’ll need to properly calibrate each sensor before relying on your air quality readings, starting with basic setup procedures that establish communication between your Arduino and sensors.
Once you’ve configured the initial parameters, you’ll set specific calibration values for each sensor type – from CO2 baseline adjustments to VOC reference concentrations.
Finally, you’ll validate your calibration work by testing against known standards to guarantee your monitoring system delivers accurate, reliable data.
Initial Sensor Setup
Before you can trust your Arduino indoor air quality monitor to deliver reliable data, proper sensor calibration becomes the foundation of accurate environmental measurements. Each sensor requires specific initialization procedures to guarantee peak performance and reliable calibration data collection.
Start with your PMS5003 PM2.5 sensor by placing it in a stable, dust-free environment for 30 minutes minimum. This stabilization period allows the laser scattering mechanism to establish baseline readings.
Next, configure your MH-Z19 CO2 sensor using setTimeToRead() and setR0() functions to define proper measurement parameters.
Essential calibration steps include:
- Position VOC sensor (MP503) with adequate warm-up time using known concentrations
- Calibrate MQ-131 ozone sensor against standard reference gases
- Establish baseline responses for all sensors
- Document initial calibration data for future reference
Calibration Parameter Configuration
After establishing your sensor baseline readings, configuring precise calibration parameters transforms these initial values into accurate environmental measurements. Each sensor requires specific calibration approaches to guarantee reliable data collection.
| Sensor Type | Calibration Method | Key Parameter |
|---|---|---|
| PMS5003 (PM2.5) | Manufacturer R0 value | R0 specification |
| MH-Z19 (CO2) | Known 400 ppm reference | Concentration adjustment |
| MP503 (VOC) | Clean air baseline | Lowest reading point |
| MQ-131 (Ozone) | setTimeToRead() + R0 | Temperature compensation |
You’ll need to perform VOC sensors baseline calibration in clean air before monitoring begins. The ozone sensor’s accuracy depends on proper setTimeToRead() configuration, accounting for temperature and humidity fluctuations. Schedule regular calibration intervals every few months to maintain sensors accuracy, especially after significant environmental changes.
Accuracy Validation Testing
Validation testing confirms your calibrated sensors deliver accurate readings by comparing their outputs against certified reference standards.
You’ll need to expose each sensor to known concentrations and verify the measurements match expected values within acceptable tolerances.
For thorough accuracy validation, conduct controlled environment testing where you can maintain stable conditions.
Start with your PMS5003 PM2.5 sensor using certified reference particles, then move to your MH-Z19 CO2 sensor with calibration gas cylinders.
Test your MP503 VOC sensor against standard gas mixtures, and validate your MQ-131 ozone sensor using certified ozone concentrations.
- Document baseline readings before calibration adjustments
- Record environmental conditions during each validation test
- Calculate percentage error between measured and actual values
- Establish acceptable accuracy thresholds for your monitoring requirements
Creating the PCB Layout for Professional Assembly
Since you’ve completed the circuit design and component selection for your Arduino indoor air quality monitor, it’s time to transform your schematic into a professional PCB layout that’ll guarantee reliable performance and clean assembly.
Start by creating your schematic in Eagle or KiCad, accurately representing your Arduino Pro Mini and all sensors. Position components logically to minimize trace lengths, especially for sensitive sensor connections.
Maintain proper spacing between traces to prevent shorts and implement ground planes for enhanced signal integrity. Include mounting holes and correctly sized pads for easy assembly within your acrylic case.
Run a Design Rule Check to catch errors in trace width, clearance, and pad dimensions. This validation step optimizes your design for both manufacturability and performance.
Building and Assembling the Custom Acrylic Case
Now you’ll build a custom acrylic case that houses your Arduino Pro Mini, Nextion display, and sensors while maintaining proper airflow for accurate readings.
You’ll need to manually cut openings and drill precise holes for M2 and M4 screws, as the tight internal space demands careful component placement planning.
Before finalizing your assembly, it’s essential you test all circuit connections on a protoboard to avoid troubleshooting issues within the confined case.
Case Design Specifications
Four distinct sections comprise the custom acrylic case design for your air quality monitor, each requiring precise measurements and careful assembly planning.
Your case design must accommodate all components while ensuring proper ventilation and display accessibility. The manual cutting process demands accuracy for the Nextion touch display opening and sensor placements.
The four-part structure offers modular assembly benefits, though you’ll need approximately seven hours of print time.
Using 15% hexagon infill maintains structural integrity without excessive material usage. You’ll secure components using M2 and M4 screws, with optional super glue for enhanced stability.
- Precise openings for Nextion display integration and sensor access
- Strategic ventilation channels for ideal airflow around sensitive components
- Modular four-section design enabling easier maintenance access
- Reinforced mounting points supporting M2/M4 hardware attachment systems
Cutting and Drilling
Begin your acrylic cutting process by measuring twice and marking all cut lines with a permanent marker, guaranteeing you’ve accounted for the Nextion display’s exact dimensions and sensor placement requirements.
Use a laser cutter or fine-toothed saw for clean cuts, applying masking tape along cut lines to prevent chipping. When drilling ventilation and mounting holes, use a drill press set to 300-500 RPM with acrylic-specific bits to prevent cracking.
Cutting requires steady pressure and slow movement to maintain precision. After drilling all necessary holes, sand edges with fine-grit sandpaper to eliminate sharp surfaces and improve aesthetics.
These careful cutting and drilling techniques guarantee your case accommodates all components while providing proper ventilation for accurate air quality readings.
Component Installation Process
Once you’ve completed all cutting and drilling operations, start the component installation by first gathering your M2 and M4 screws, confirming you have the correct quantities for each component’s mounting requirements.
Begin by positioning your Arduino and air quality sensors within the case, maintaining proper spacing for ideal functionality. You’ll want to secure each component firmly while confirming the display remains easily accessible.
During component installation, focus on creating strategic ventilation pathways that allow accurate air quality readings. Your sensors need proper airflow to function correctly, so don’t obstruct their openings.
- Mount the Arduino board using M4 screws for maximum stability
- Position air quality sensors near ventilation holes for accurate readings
- Confirm display components remain accessible after installation
- Double-check all wiring connections before final assembly
Press the grates into their designated openings without adhesive initially, though super glue provides permanent securing if needed.
Installing Temperature and Humidity Monitoring With DHT22
While building your air quality monitor, you’ll find the DHT22 sensor provides exceptional accuracy for tracking indoor temperature and humidity levels. This digital sensor delivers precise readings from -40°C to 80°C for temperature and 0% to 100% for humidity, making it perfect for your Arduino Air Quality Monitor project.
Connect a 4.7kΩ to 10kΩ pull-up resistor between the data pin and VCC for stable communication. The DHT22’s single-wire protocol simplifies wiring, requiring only one data pin on your Arduino.
The DHT22’s simple single-wire design needs just one pull-up resistor for reliable data transmission to your Arduino.
Install the DHT library to streamline your code—you’ll read both temperature and humidity with just a few commands.
Position your sensor in a well-ventilated area, avoiding direct heat sources or drafts to guarantee accurate environmental readings for ideal monitoring performance.
Implementing Real-Time Data Display and Historical Tracking
With your temperature and humidity sensors collecting environmental data, you’ll need a robust display system to visualize this information alongside readings from your PM2.5, CO2, VOC, and ozone sensors.
The 2.8″ Nextion touch display serves as your primary interface, showing real-time data from all environmental sensors simultaneously. Your Arduino Pro Mini processes incoming sensor values and updates display variables continuously using specialized libraries.
The system stores historical data from the past 24 hours, letting you track air quality trends and identify patterns. Touch hotspots enable seamless navigation between current readings and historical views.
- Configure sensor calibration settings, especially ozone sensor’s setTimeToRead() and setR0() values
- Program touch hotspot coordinates for intuitive navigation
- Implement data storage arrays for 24-hour historical tracking
- Design clear visual layouts displaying multiple parameters simultaneously
Troubleshooting Common Sensor and Programming Issues
Even experienced builders encounter sensor connectivity problems and programming errors that can derail an otherwise well-designed air quality monitoring system.
Start by checking all sensor connections—loose or incorrect wiring causes inaccurate sensor readings and initialization failures. You’ll want to incorporate the `isnan()` function in your code to detect invalid readings, helping identify malfunctioning sensors requiring recalibration.
Loose wiring disrupts sensor accuracy—use `isnan()` to catch invalid readings and identify sensors needing recalibration.
Verify you’re using correct resistor values, as wrong values lead to Arduino malfunctions and erroneous data when monitoring air pollution levels. For ozone sensors, properly configure `setTimeToRead()` and `setR0()` values for accurate measurements.
If you’re using an RTC module, test its connections and functionality since RTC issues create incorrect timestamps and data logging problems.
Testing Your Air Quality Monitor With Different Pollution Sources
After resolving sensor connectivity and programming issues, you’ll need to validate your air quality monitor’s accuracy by exposing it to known pollution sources.
Testing with controlled particulate matter generation helps guarantee your device responds correctly to real-world conditions.
Use a butane lighter or smoke machine to create particulate matter and watch PM2.5 readings spike.
Burning incense or candles provides excellent VOC testing scenarios.
Try aerosol sprays and cleaners in controlled environments to assess their impact on air quality readings.
Monitor cooking activities like frying or grilling, which produce significant pollutants.
- Butane lighter testing – Generate controlled particulate matter to verify PM2.5 sensor responsiveness
- Incense burning – Test VOC detection capabilities against baseline measurements
- Aerosol spray testing – Assess MP503 sensor’s ability to detect cleaning product emissions
- Cooking monitoring – Record real-world pollution data during frying and grilling activities
Analyzing Collected Data and Understanding Air Quality Classifications
Once you’ve gathered sufficient data from your air quality monitor, you’ll need to interpret the readings to understand what they mean for your indoor environment.
Export your measurements to .csv files for thorough analysis of your data set. Track trends in PM2.5, CO2, VOCs, and Ozone concentrations over time to identify pollution sources.
Data export to CSV format enables comprehensive tracking of PM2.5, CO2, VOCs, and ozone trends for effective pollution source identification.
Your monitor classifies air quality based on specific thresholds: readings below 181 indicate “GOOD!” conditions, while levels exceeding 350 signal “Toxic” air requiring immediate attention. PM2.5 serves as a critical indicator for respiratory health impacts.
Analyze patterns related to cooking, aerosol use, or other activities that spike pollutant levels. Understanding these air quality classifications helps you recognize health risks and develop effective strategies for maintaining cleaner indoor air.
Future Enhancements With Wifi Connectivity and Remote Monitoring
While your current Arduino air quality monitor provides valuable local readings, adding WiFi connectivity transforms it into a powerful remote monitoring system that lets you track indoor air quality from anywhere.
This upgrade enables real-time data access through your smartphone or computer, making air quality monitoring more convenient and thorough.
You can implement this enhancement using ESP8266 or ESP32 microcontrollers, which provide built-in WiFi capabilities.
MQTT protocol facilitates efficient communication with cloud services, enabling seamless data transmission and alert notifications.
Key benefits of WiFi connectivity include:
- Real-time remote access to air quality data via mobile apps
- Cloud-based visualization of historical trends and patterns
- Automated alerts for poor air quality conditions
- Long-term data logging for environmental analysis and community sharing
Frequently Asked Questions
How Long Do Mq-Series Gas Sensors Typically Last Before Needing Replacement?
MQ-series gas sensors typically last 2-5 years with continuous use, but you’ll notice declining accuracy after 1-2 years. You should replace them when readings become inconsistent or drift considerably from calibrated values.
Can This Air Quality Monitor Be Used Outdoors in Weather Conditions?
You shouldn’t use standard Arduino boards and MQ-series sensors outdoors without weatherproof enclosures. Rain, humidity, and temperature extremes will damage electronics. You’ll need waterproof housing and temperature-compensated sensors for reliable outdoor operation.
What Is the Estimated Total Cost for All Components and Materials?
You’ll spend approximately $50-80 total for basic components including Arduino Uno, air quality sensors, display, breadboard, jumper wires, and enclosure. Premium sensors can increase costs to $100-150 depending on your chosen specifications.
How Often Should I Recalibrate the Sensors for Maintaining Accuracy?
You’ll want to recalibrate your air quality sensors every 6-12 months for ideal accuracy. Temperature and humidity sensors need less frequent calibration, typically annually, while gas sensors require more attention.
Is It Safe to Leave the Monitor Running Continuously 24/7?
You can safely run your monitor continuously 24/7. Guarantee proper ventilation around the device, use quality power supplies, and monitor for overheating. Most sensors are designed for continuous operation.

Leave a Reply