You’ll discover that building a Node-RED dashboard for air quality monitoring isn’t as complex as it might seem, but there’s a specific sequence you must follow to avoid costly mistakes. The key lies in understanding how your sensors communicate with the gateway and why certain configuration steps can make or break your entire monitoring system. What most people don’t realize is that the order of your node connections determines whether you’ll get accurate real-time data or frustrating delays.
Understanding Node-RED Architecture for IoT Applications

When you’re building IoT applications for air quality monitoring, Node-RED’s flow-based architecture transforms complex sensor data management into an intuitive visual programming experience.
You’ll work with nodes that serve as building blocks, representing inputs, outputs, and processing functions within your Node-RED flow. This modular approach eliminates traditional coding requirements while maintaining powerful functionality.
Each node connects seamlessly to create automated workflows that handle sensor data collection, processing, and visualization. You can drag and drop components through the browser-based editor, establishing connections that define how air quality data flows through your system.
Visual nodes connect effortlessly, creating automated workflows for seamless air quality data collection, processing, and real-time monitoring through intuitive drag-and-drop programming.
The architecture supports real-time data transmission, enabling immediate responses to environmental changes. You’ll find this visual programming approach considerably reduces development time while providing the flexibility to customize monitoring solutions according to your specific requirements.
Essential Hardware Components for Air Quality Sensing
Building your Node-RED air quality monitoring system requires specific hardware components that work together to capture, process, and transmit environmental data.
You’ll need an ESP8266 microcontroller as your foundation, providing WiFi connectivity to send sensor data to your Node-RED dashboard. The ENS160 sensor serves as your primary air quality detector, measuring volatile organic compounds and various environmental indicators.
Complement this with an AHT21 sensor for accurate temperature and humidity readings, creating thorough air quality assessments.
Ensure you’ve got a stable power supply delivering at least 1A to power all components reliably.
Don’t overlook proper wiring and enclosure – keep connections short to prevent communication disruptions, and use protective housing to shield sensors from environmental factors that could compromise accuracy.
Setting Up the NCD Enterprise IIoT Gateway
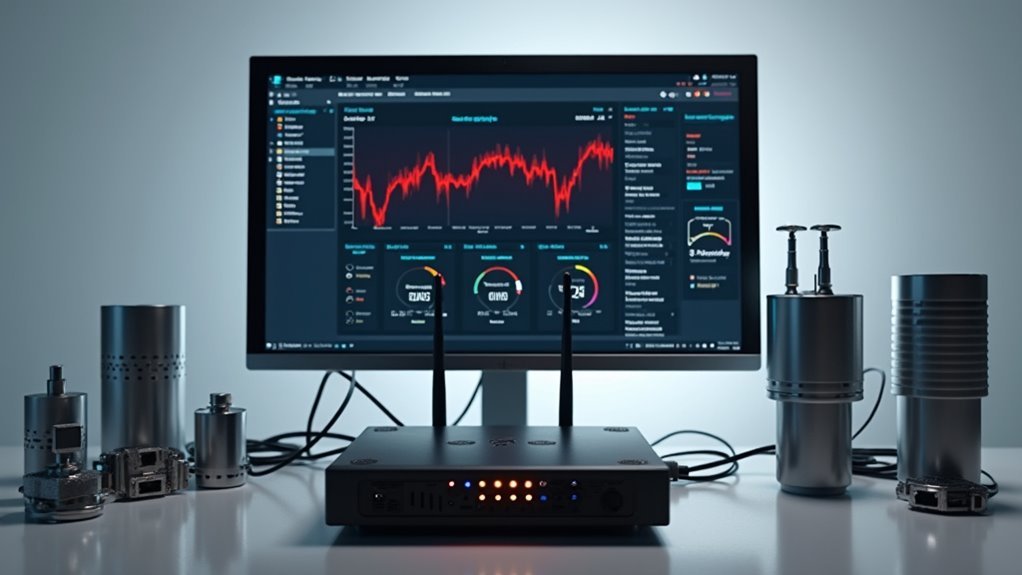
You’ll need either a standard or Lite version of the NCD Enterprise IIoT Gateway, depending on your specific air quality monitoring requirements.
The gateway comes pre-installed with Node-RED and the NCD Library, but you’ll also need to install FlowFuse Dashboard 2 for creating your data visualizations.
Connect your gateway to your network via WiFi or Ethernet to guarantee real-time data transmission from your particulate matter sensors to the dashboard.
Gateway Hardware Requirements
Five essential components form the foundation of your NCD Enterprise IIoT Gateway setup for air quality monitoring. You’ll need compatible sensors like the Industrial IoT Wireless Particulate Matter Sensor or Air Quality CO2 Temperature Humidity Sensor. A computer with WiFi or Ethernet enables access to your Node-RED Dashboard and gateway interface.
| Component | Requirement |
|---|---|
| Gateway Model | Standard (full features) or Lite (reduced capabilities) |
| Power Supply | Minimum 1A stable power |
| Sensors | Particulate Matter or CO2/Temperature/Humidity |
| Network Access | WiFi or Ethernet connection |
Your gateway requires pre-installed Node-RED and NCD Library, plus FlowFuse Dashboard 2 for visualization capabilities. The power supply must deliver at least 1A to guarantee reliable operation of all connected components in your customizable IIoT installation.
Node-RED Software Installation
Since your NCD Enterprise IIoT Gateway arrives with Node-RED and the NCD Library pre-installed, you can immediately begin configuring your air quality monitoring system.
You’ll need a computer with WiFi or Ethernet connectivity to access the Node-RED interface effectively. The gateway’s node-based architecture allows seamless sensor data management right out of the box.
To enable thorough data visualizations, install FlowFuse Dashboard 2 through the Node-RED Palette Manager. This installation provides essential tools for creating dynamic air quality dashboards.
Choose between the standard version offering full functionality or the Lite version for simplified deployments. The pre-installed NCD Library guarantees compatibility with various air quality sensors, while the node structure facilitates easy configuration and data flow management for your monitoring applications.
Network Configuration Setup
With Node-RED and FlowFuse Dashboard 2 ready for deployment, configuring your NCD Enterprise IIoT Gateway’s network settings becomes the next logical step.
You’ll need a computer with WiFi or Ethernet connection to access the Gateway’s web-based interface and manage sensor data effectively.
Follow these essential configuration steps:
- Access the Gateway interface – Connect to your Gateway’s IP address through your web browser to reach the configuration panel.
- Configure network credentials – Set up WiFi or Ethernet parameters to guarantee reliable data transmission from your air quality sensors.
- Enable security features – Activate SSH access and remote management options for secure Gateway operation.
The Gateway’s dynamic sensor selection via MAC address automatically updates your dashboard as new air quality sensors connect, streamlining data integration.
Installing FlowFuse Dashboard 2 Package

You’ll need to install the FlowFuse Dashboard 2 package through Node-RED’s Palette Manager to create your air quality monitoring interface.
The installation process involves specific steps within the Palette Manager and requires verification that the new nodes appear correctly in your workspace.
Let’s walk through both the installation steps and the node verification process to confirm your dashboard components are ready for building air quality visualizations.
Palette Manager Installation Steps
Installing the FlowFuse Dashboard 2 package requires three straightforward steps through Node-RED’s built-in Palette Manager.
These palette manager installation steps guarantee you’ll have the necessary dashboard components for your air quality monitoring project.
Follow these essential steps:
- Access the Palette Manager – Click the hamburger menu in Node-RED’s top right corner and select “Manage palette” to open the Palette Manager window.
- Search and Install – Navigate to the “Install” tab, search for “FlowFuse Dashboard 2,” then click the “Install” button to download and add the nodes automatically.
- Refresh and Verify – Once installation completes, refresh your browser interface to guarantee all new dashboard nodes appear in your workspace palette for immediate use.
Node Verification Process
After completing the installation, you should verify that FlowFuse Dashboard 2 nodes appear correctly in your Node-RED workspace.
Navigate to the nodes palette on the left side of your interface and confirm that the dashboard nodes are now visible and accessible. Node-RED offers an intuitive visual confirmation system where successfully installed packages display their respective nodes immediately after installation.
Check for nodes labeled with “dashboard” or “ui” prefixes, which indicate the FlowFuse Dashboard 2 components you’ll use for air quality visualization.
If the nodes don’t appear, restart Node-RED and refresh your browser. You can also verify installation success by accessing the Palette Manager again and confirming the package shows as “installed” status rather than available for download.
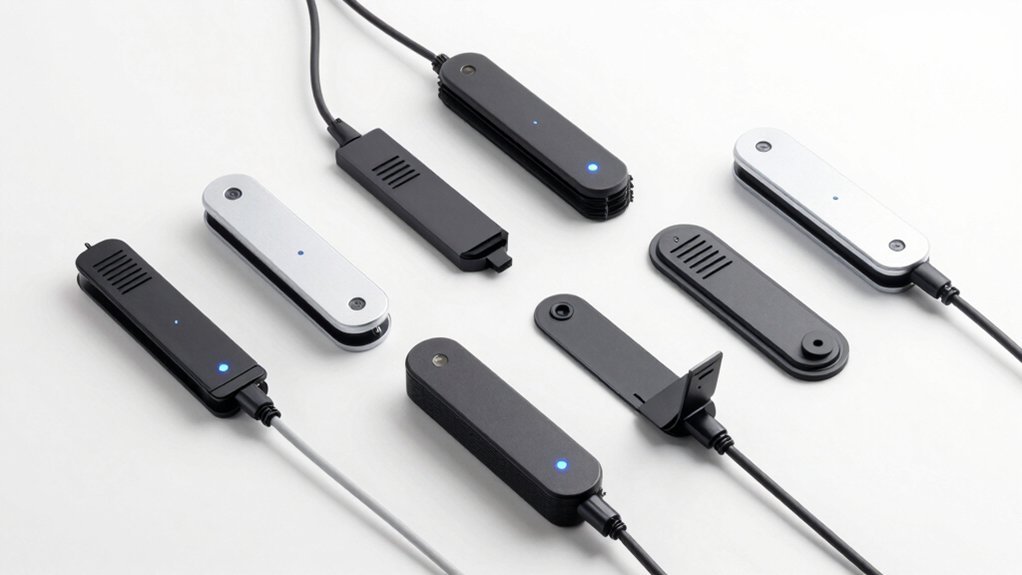
Configuring Smart Particulate Matter Sensors
When configuring smart particulate matter sensors for your Node-RED dashboard, you’ll need to establish the connection between your sensor’s optical detection system and the data transmission pathway.
These sensors use light scattering technology to accurately detect PM2.5 and PM10 particles in real-time, making them ideal for both indoor and outdoor monitoring applications.
Light scattering technology enables precise real-time detection of PM2.5 and PM10 particles for comprehensive indoor and outdoor air quality monitoring.
To properly configure your sensors for Node-RED integration, follow these essential steps:
- Set up cloud platform connectivity to enable seamless data transmission from your compact sensor units.
- Configure the local datalogger to generate CSV files for storing historical air quality metrics.
- Establish dashboard visualization parameters to display mass concentration, number concentration, and historical data trends.
Your sensors’ compact design guarantees adaptability across various environments, from urban monitoring stations to residential settings, providing thorough air quality data management.
Importing the NCD Dashboard JSON Template
You’ll need to access the NCD GitHub repository to obtain the JSON template for your air quality dashboard.
Copy the JSON code and use Node-RED’s import function to paste it into the dialog box, which instantly creates your dashboard structure.
Once imported, you can configure the dashboard nodes to match your specific sensor setup and customize the visualization components for ideal monitoring.
Accessing JSON Repository
To streamline your air quality monitoring dashboard setup, the NCD (National Control Devices) provides a pre-built JSON template that you can import directly into Node-RED.
When accessing the json repository, you’ll find thorough dashboard configurations designed specifically for environmental monitoring applications.
Follow these steps to locate the template:
- Navigate to NCD’s GitHub repository – Search for their official dashboard collection containing air quality monitoring templates and environmental sensor configurations.
- Identify the correct JSON file – Look for files labeled with air quality, environmental monitoring, or sensor dashboard keywords to guarantee compatibility.
- Copy the JSON code – Select the entire template code and copy it to your clipboard for importing into your Node-RED workspace.
This repository contains tested configurations that’ll accelerate your dashboard development process.
Import Process Steps
After you’ve copied the JSON template code, importing it into Node-RED requires accessing the built-in import functionality through the application’s menu system.
Navigate to the hamburger menu in the top-right corner and select “Import” from the dropdown options. This opens a dialog box where you’ll paste the copied JSON code into the designated text field.
The import process steps are straightforward: click “Import” to execute the operation, and the NCD Dashboard elements will immediately appear in your Node-RED editor workspace.
You’ll see the dashboard nodes and flows arranged according to the template configuration. Before deploying, verify that all necessary dependencies are installed and properly connected.
Once you’ve customized any settings for your specific air quality sensors, deploy the changes to activate your monitoring dashboard.
Dashboard Node Configuration
Once the NCD Dashboard template appears in your workspace, configuring the individual dashboard nodes becomes your next priority for establishing effective air quality monitoring.
The dashboard node configuration process in Node-RED involves customizing essential properties to guarantee ideal sensor data management.
Follow these configuration steps:
- Customize node properties by double-clicking each dashboard node to access naming options and data storage paths for proper sensor data organization.
- Configure Wireless Gateway nodes to establish reliable communication channels between your air quality sensors and the Node-RED environment.
- Set up Debug nodes to monitor real-time data flow and troubleshoot any connectivity issues during initial testing phases.
These configurations establish the foundation for accessing your dashboard through Node-RED’s “Dashboard 2.0” sidebar option.
Establishing MQTT Communication Protocols
When building your Node-RED dashboard for air quality monitoring, establishing robust MQTT communication protocols forms the backbone of your data transmission system.
You’ll need to configure MQTT nodes properly by setting up subscription topics to receive sensor data and publish topics for device commands. Guarantee your device ID and Mosquitto broker address are correctly entered in the MQTT node settings to establish stable connections.
Configure QoS levels strategically—use QoS 0 for frequent updates, QoS 1 for important readings, and QoS 2 for critical commands.
Utilize Node-RED’s debugging tools to monitor incoming data streams and verify your air quality sensor data formatting. This verification process guarantees your dashboard receives clean, properly structured data for accurate environmental monitoring and analysis.
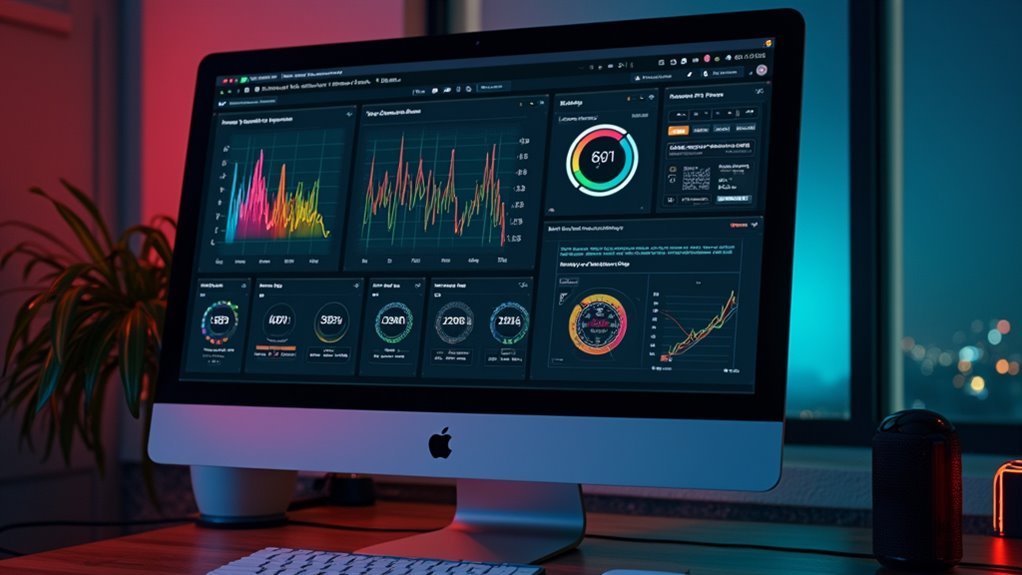
Creating Real-Time Data Visualization Elements
Three core visualization components will transform your incoming MQTT data into meaningful real-time displays for air quality monitoring using Node-RED’s FlowFuse Dashboard 2.
You’ll create interactive gauges and charts that automatically update as your smart sensors transmit PM2.5 and PM10 concentrations through MQTT protocols.
Your Dashboard implementation requires these essential elements:
Essential dashboard elements include gauge nodes, chart nodes, and dropdown selectors for comprehensive air quality monitoring visualization.
- Gauge nodes – Display current mass and number concentrations with customizable thresholds and color-coded alerts for immediate air quality assessment.
- Chart nodes – Show historical data trends alongside real-time readings, enabling thorough temporal analysis of particulate matter levels.
- Dropdown selector – Allow users to switch between multiple sensor locations using MAC addresses for centralized monitoring.
Configure NCD Dashboard nodes to customize appearance and functionality, ensuring your visualization meets specific monitoring requirements while maintaining real-time responsiveness.
Implementing Local Data Storage and CSV Logging
While real-time visualization provides immediate insights into air quality conditions, you’ll need persistent storage to capture historical trends and enable extensive data analysis. Node-RED’s local data storage capabilities generate and store sensor readings as CSV files, making data access and management straightforward.
You can customize the default storage path within the Node-RED folder based on your operating system requirements.
Configure dynamic sensor selection using MAC addresses to automatically update dashboard information, streamlining your data management workflow. The dashboard includes historical data visualization features that reveal air quality trends over time.
Regular inspection of stored CSV files enables thorough analysis of incoming sensor data, helping you identify anomalies in air quality readings and maintain accurate monitoring records.
Building Interactive Gauges and Charts
Having established robust data storage capabilities, you can now transform raw sensor readings into compelling visual displays that make air quality monitoring intuitive and actionable.
Using NodeRED dashboard nodes, you’ll create dynamic interfaces that respond instantly to changing environmental conditions.
Dynamic NodeRED dashboard interfaces provide instant visual feedback as environmental sensors detect real-time changes in air quality conditions.
Configure your dashboard components systematically:
- Set up gauge nodes for real-time PM2.5, PM10, temperature, and humidity readings, defining color-coded thresholds that visually indicate safe or hazardous levels.
- Implement line chart nodes to display historical trends, enabling users to analyze data patterns and identify pollution fluctuations over time.
- Add dropdown menus for sensor selection by MAC address, allowing users to switch between multiple monitoring locations seamlessly.
Ensure your dashboard remains responsive and interactive, enabling detailed readouts through gauge clicks and precise historical values via chart hover functionality.
Setting Up Historical Data Analysis Features
You’ll need robust data storage and visualization capabilities to analyze air quality trends over time.
CSV data storage provides a simple yet effective method for logging sensor readings, while time-series visualization tools transform this raw data into meaningful charts and graphs.
These features enable you to identify patterns, track pollution sources, and make informed decisions based on historical air quality conditions.
CSV Data Storage
Two essential components form the backbone of effective air quality monitoring: real-time data visualization and detailed historical data storage.
Your Node-RED setup automatically generates CSV files containing extensive sensor data, enabling broad historical analysis and air quality trend tracking over time.
The csv data storage system provides three key advantages:
- Automated file generation – Sensor data saves automatically in CSV format within your Node-RED folder, with customized paths based on your operating system.
- Browser-based downloads – You can directly download locally stored files using an intuitive date picker with mm/dd/yyyy format selection.
- Dynamic updates – Regular sensor selection via MAC address ensures your CSV files contain the most recent data for accurate historical records.
Time-Series Visualization Tools
Since storing raw CSV data only provides a foundation for analysis, you need robust time-series visualization tools to transform your air quality measurements into actionable insights.
Configure InfluxDB as your time-series database using the `CREATE DATABASE` command to create a dedicated air quality database. This enables efficient storage and retrieval of historical records with organized structure.
Connect Grafana to InfluxDB as a data source to build dynamic dashboards visualizing PM2.5 and PM10 trends over time.
Implement time-series queries in Node-RED to extract historical data from InfluxDB, then display results using line charts or bar graphs in your dashboard.
Regularly update your Node-RED flows to include fresh data points, ensuring visualizations reflect current sensor measurements for thorough air quality monitoring.
Integrating Multiple Sensor Nodes by MAC Address
Managing air quality across multiple locations becomes straightforward when you leverage Node-RED’s ability to integrate sensor nodes by their unique MAC addresses.
The NCD Dashboard’s dropdown menu feature enables dynamic sensor selection, making real-time monitoring seamless without manual configuration.
Here’s how you’ll optimize your multi-sensor setup:
- Configure the Wireless Gateway node to output complete sensor information, ensuring each device’s sensor code and MAC address are properly transmitted to your Node-RED interface.
- Customize NCD Dashboard node properties to reflect the selected sensor’s data accurately, providing precise air quality measurements for each location.
- Utilize the “Inspect” button to access detailed object data, giving you thorough insights into each sensor’s status and performance metrics.
New sensors automatically appear in your dropdown list upon connection, streamlining your monitoring workflow.
Optimizing Dashboard Performance and Responsiveness
When monitoring air quality across multiple sensor nodes, your dashboard’s performance directly impacts the effectiveness of real-time data analysis. To enhance your Node-RED dashboard performance, you’ll need to balance visual appeal with system efficiency.
Use function nodes strategically to minimize flow complexity and reduce processing overhead. Configure data transmission intervals that provide meaningful updates without overwhelming your server. Implement filtering techniques to limit visualization data during peak usage periods.
| Enhancement Strategy | Implementation Method | Performance Impact |
|---|---|---|
| Node Reduction | Combine logic in function nodes | Reduces CPU overhead |
| Data Filtering | Limit displayed timeframes | Improves responsiveness |
| Transmission Intervals | Adjust update frequencies | Balances load/accuracy |
| Historical Data Cleanup | Regular data purging | Prevents degradation |
Regular maintenance guarantees your dashboard maintains peak responsiveness while delivering actionable air quality insights.
Deploying Your Complete Air Quality Monitoring System
After optimizing your dashboard’s performance, you’re ready to deploy the complete air quality monitoring system that transforms your collected data into actionable insights.
Your deployment requires essential hardware components and proper configuration to guarantee seamless operation.
Successful deployment demands carefully selected hardware components and meticulous configuration to ensure uninterrupted, reliable system performance.
To deploy your system effectively, follow these key steps:
- Install Core Components – Set up your Enterprise IIoT Gateway with Node-RED locally, confirming FlowFuse Dashboard 2 is properly installed alongside your Smart Particulate Matter Sensor for thorough data collection.
- Configure Data Management – Establish your local data logger to generate CSV files and configure Wireless Gateway nodes with Debug nodes for effective sensor data transmission using MQTT protocols.
- Import Visualization Tools – Load the NCD Dashboard JSON file into Node-RED locally to access interactive gauges, charts, and buttons for real-time monitoring and historical analysis.
Frequently Asked Questions
What Are the Ongoing Maintenance Requirements for Outdoor Air Quality Sensors?
You’ll need to clean sensors monthly, calibrate them quarterly, replace filters regularly, check weatherproof seals, update firmware, monitor power sources, and validate data accuracy against reference standards for reliable outdoor air quality measurements.
How Much Does It Cost to Build a Complete Air Quality Monitoring System?
You’ll spend $200-800 for a complete system. Basic sensors cost $50-150, microcontrollers $20-50, housing $30-100, and connectivity modules $25-75. Professional-grade sensors increase costs to $1,000-3,000 depending on accuracy requirements.
Can the Dashboard Send Automated Alerts When Air Quality Thresholds Are Exceeded?
You can configure automated alerts using Node-RED’s notification nodes. Set threshold values, connect email/SMS nodes, and create conditional flows that trigger when air quality readings exceed your defined limits automatically.
What Internet Bandwidth Is Required for Continuous Real-Time Data Transmission?
You’ll need minimal bandwidth for continuous real-time air quality data transmission. Sensor readings typically require only 1-5 Kbps per device, so even basic broadband or cellular connections can easily handle multiple monitoring stations simultaneously.
How Long Do Air Quality Sensor Batteries Typically Last in Field Conditions?
You’ll typically see air quality sensor batteries last 6-12 months in field conditions, depending on transmission frequency, environmental temperature, and sensor types. Cold weather and frequent data transmission drain batteries faster.

Leave a Reply