You’ve installed Home Assistant and heard Node-RED can supercharge your smart home automations, but the interface looks intimidating with its colorful nodes and connecting wires. Don’t worry—mastering Node-RED isn’t as complex as it appears. Once you understand three fundamental concepts, you’ll transform from someone who struggles with basic flows into someone who creates sophisticated automations that respond intelligently to your home’s changing conditions.
Understanding Nodes and Message Flow

When you first open Node-RED, you’ll discover that nodes function as the fundamental building blocks of your automation system. Each node serves a specific purpose—input nodes receive data from smart devices, processing units manipulate that information, and output nodes send commands back to your devices.
These nodes connect together to create message flow pathways that handle your automation tasks. Messages travel between nodes as JSON objects, carrying data like sensor readings or device states.
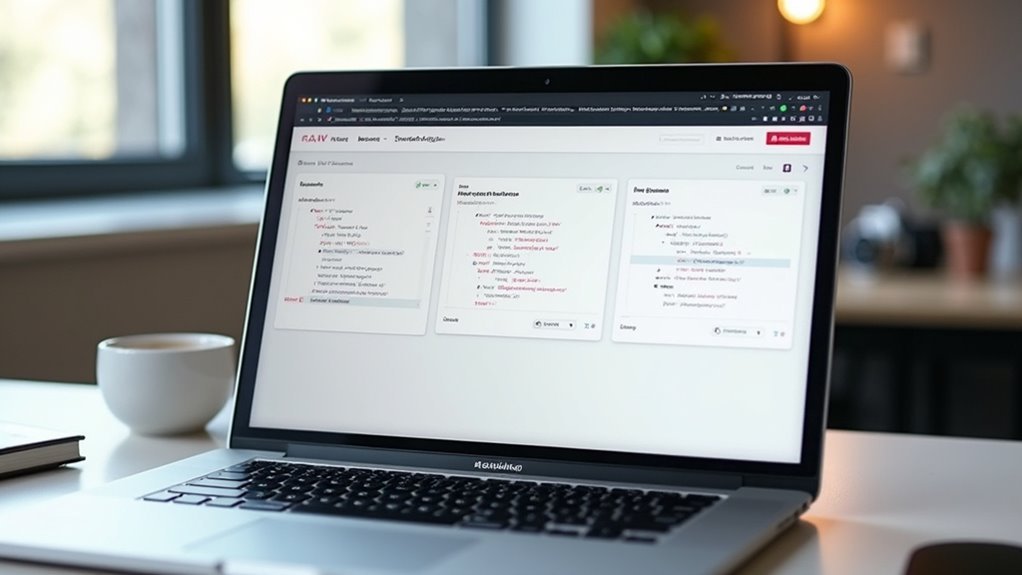
The visual editor displays these connections clearly, letting you see exactly how information moves through your system. You’ll find the debug node particularly helpful—it monitors outputs at any stage, showing you what’s happening inside your flows and helping you troubleshoot when automations don’t work as expected.
Setting Up Your First Automation
Once you’ve grasped how nodes work together, you’ll want to create your first automation to see Node-RED in action.
Start by installing the Node-RED add-on through Home Assistant’s supervisor to access the web interface.
Begin your flow with an inject node to trigger your home automation based on specific events or schedules.
Connect an events: state node to monitor device state changes, ensuring proper configuration for your target entities.
Add a call service node to make Home Assistant execute actions like controlling lights or adjusting settings.
Deploy your flow and monitor the debug window to verify everything works correctly.
This simple Node-RED setup demonstrates how visual programming can streamline your smart home automations.
Debugging and Testing Your Workflows

After creating your first automation, you’ll need to verify it works as expected through proper debugging and testing. Node-RED provides powerful tools to monitor and troubleshoot your flows effectively.
- Access the debug window by clicking the bug icon on the right sidebar. This essential tool displays debug outputs and message payloads from your automations in real-time.
- Deploy and test your flows while monitoring the debug window. Watch how data moves through each node and verify your automation behaves correctly.
- Clear the debug window using the trash icon to maintain a clean workspace when testing new flows or isolating issues.
- Add debug nodes strategically throughout your flows to capture specific message payloads at various points, making troubleshooting much easier.
Frequently Asked Questions
How Do I Set up Node-Red With Home Assistant?
Install Node-RED add-on from Home Assistant’s add-on store, configure it to start on boot, then access it via the provided link. Set up MQTT broker, incorporate Home Assistant nodes, and you’ll create visual automations easily.
What Are the Disadvantages of Node-Red?
You’ll face steeper learning curves with flow-based programming, potential performance issues with complex flows, challenging debugging processes, inconsistent documentation quality, and risk of over-engineering simple automations into unnecessarily complicated solutions.
Is Node-Red Easy to Learn?
You’ll find Node-RED relatively easy to learn thanks to its visual drag-and-drop interface, thorough documentation, and active community support that helps you create automations without extensive programming knowledge.
How Do I Get Started With Node-Red?
You’ll start by installing Home Assistant, then add Node-RED through the official add-on store. Once installed, explore the visual flow editor by dragging nodes around and use the debug window to monitor your automation flows.

Leave a Reply