
You’re probably tired of jumping between multiple browser tabs just to check your home server status, IoT sensors, and network performance. The good news is that several powerful open-source tools can consolidate everything into a single, customizable dashboard that’ll save you time and frustration. While Grafana dominates the monitoring space, you’ll discover that other specialized tools might better suit your specific needs, budget constraints, and technical comfort level.
Grafana: The Industry Standard for Monitoring Dashboards
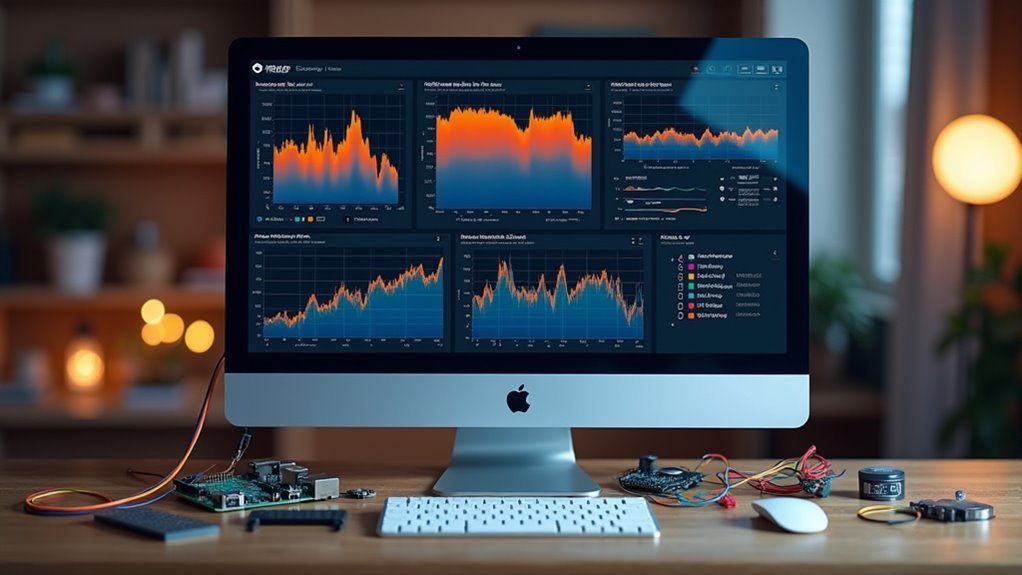
When building a home dashboard, Grafana stands out as the go-to open-source solution that’s earned its reputation as the industry standard for monitoring and visualization.
You’ll appreciate its extensive customization options across multiple data sources like Prometheus, Graphite, and Elasticsearch. The platform’s advanced data visualization capabilities let you create tailored dashboards that meet your specific monitoring needs.
You can connect Grafana to multiple data sources simultaneously, giving you thorough real-time monitoring of your home systems.
While it requires initial configuration, the robust plugin ecosystem and alerting mechanisms make the setup worthwhile. The community-driven development guarantees you’re getting continuous improvements and reliable support for your home monitoring solution.
Metricfire: Hosted Solution With Open-Source Power
You’ll get Grafana’s powerful visualization capabilities without wrestling with server setup, updates, or maintenance headaches.
MetricFire handles all the infrastructure complexity while giving you access to enterprise-grade features like advanced alerting, team collaboration tools, and seamless integrations with your existing DevOps stack.
This means you can focus on building meaningful dashboards instead of troubleshooting configuration files and managing databases.
Managed Grafana Benefits
Although setting up and maintaining your own Grafana instance can be time-consuming and complex, MetricFire offers a compelling alternative with its fully managed Grafana solution that delivers open-source power without the operational overhead.
The managed Grafana benefits include immediate access to production-ready dashboards without manual configuration headaches. You’ll get seamless integration with your existing DevOps workflows, including Terraform, Kubernetes, and AWS, streamlining your operations considerably.
Custom alerting and real-time monitoring capabilities come ready out of the box, enabling you to respond quickly to system changes.
The platform supports diverse data sources like Prometheus and Graphite, ensuring extensive monitoring across all your applications. This approach lets teams with varying technical expertise harness Grafana’s full capabilities.
Enterprise Features Included
While open-source tools provide flexibility, MetricFire’s hosted solution delivers enterprise-grade features that’d typically require significant investment and technical expertise to implement independently.
You’ll access fully managed Grafana dashboards integrated with DevOps workflows like Terraform and Kubernetes, eliminating infrastructure concerns. The platform offers custom alerting capabilities that enable rapid responses to system changes, maintaining operational reliability without manual oversight.
Your team can collaborate seamlessly by sharing dashboards and insights, streamlining data-driven decision-making across departments.
MetricFire’s scalable architecture handles large metric volumes while maintaining high performance, making it suitable for enterprise environments.
You’re fundamentally getting the power of open source tools like Grafana and Prometheus with enterprise reliability, security, and support—all without managing the underlying infrastructure complexity yourself.
Freeboard: Lightweight Dashboard Builder for IoT Applications

If you’re looking for a dashboard solution that doesn’t require backend setup or coding expertise, Freeboard’s drag-and-drop interface lets you create visualizations quickly and intuitively.
You’ll find it particularly useful for connecting IoT devices through various data sources like web APIs and MQTT, making real-time monitoring straightforward for home automation projects.
The platform’s focus on simplicity means you can get your dashboard running in minutes rather than hours of configuration.
Drag-and-Drop Interface Design
When you need a straightforward dashboard solution for IoT projects, Freeboard’s drag-and-drop interface eliminates the complexity typically associated with data visualization setup.
This dashboard tool designed with simplicity in mind lets you create professional-looking displays without writing any backend code.
You’ll find the interface intuitive—simply drag widgets onto your canvas and configure them to display your data.
Whether you’re pulling information from web APIs or MQTT feeds, you can connect various data sources with minimal effort.
The visual editor allows you to arrange gauges, charts, and indicators exactly where you want them.
You can quickly prototype monitoring dashboards for home automation systems or create public displays for small projects, making Freeboard perfect for straightforward IoT visualization needs.
IoT Device Integration
Since most IoT projects require connecting multiple device types and protocols, Freeboard streamlines this integration process through its flexible data source configuration.
You can easily connect various IoT devices by pulling data from web APIs, MQTT brokers, or custom endpoints without writing backend code. The platform’s real-time update capability guarantees your dashboard reflects live device data instantly, making it perfect for monitoring sensors, switches, or automated systems throughout your home.
You’ll find Freeboard’s data sources particularly valuable when managing different communication protocols simultaneously.
Whether you’re tracking temperature sensors via MQTT or pulling energy usage data through REST APIs, the tool handles multiple connections seamlessly. This versatility makes it an excellent choice for thorough home automation dashboards that need to display information from diverse device ecosystems in one unified interface.
Dashy: Privacy-Focused Dashboard for Homelabs
While many dashboard solutions require complex setup procedures or compromise user privacy, Dashy stands out as a homelab-focused application that puts control firmly in your hands.
This open-source tool offers over 50 pre-built widgets that pull dynamic content from any API-enabled service, letting you integrate all your applications seamlessly.
You’ll configure everything through a simple YAML file with real-time validation and helpful hints—no programming experience required. The setup couldn’t be easier: deploy Dashy with a single Docker command and start building your personalized dashboard immediately.
With multi-language support including English, German, and French, Dashy guarantees accessibility for users worldwide while maintaining its core focus on privacy and customization for your homelab environment.
Mozak: Node.js-Based Customizable Dashboard Tool

Built on Node.js technology, Mozak delivers a developer-friendly approach to dashboard creation that doesn’t sacrifice accessibility for non-technical users.
You’ll configure your dashboards through simple JavaScript settings, making customization straightforward regardless of your technical background. The tool’s responsive HTML design guarantees your dashboards work seamlessly across smartphones, tablets, and desktops.
You can integrate multiple data sources to create tailored dashboards that extend beyond basic home monitoring applications. Mozak’s scalable architecture grows with your needs, while its extendable framework supports diverse use cases.
The platform offers an online demo where you’ll explore features before implementation. Since Mozak’s source code is available on GitHub under MIT license, you’re free to modify and customize the tool according to your specific requirements.
Dashbuilder: Java-Based Tool With Extensive Visualization Options
If you’re comfortable with Java development, Dashbuilder offers a robust framework architecture that lets you build sophisticated home dashboards with extensive customization capabilities.
You’ll appreciate its real-time dashboard creation features, which enable you to monitor your smart home devices, energy consumption, or security systems as data changes occur.
The tool’s Java foundation provides excellent performance and scalability, making it ideal for handling multiple data streams simultaneously in your home automation setup.
Java Framework Architecture
When you’re seeking a robust Java-based solution for dashboard creation, Dashbuilder stands out as a powerful tool that delivers extensive visualization capabilities and seamless customization options. This open-source dashboard tool leverages Java’s enterprise-grade architecture to provide reliable performance for both static and real-time dashboards.
- Multiple visualization libraries – Access various charting and graphing options out of the box
- JBoss community integration – Seamlessly connects with existing enterprise tools and workflows
- Apache 2 licensing – Guarantees transparency and encourages community-driven development
- Flexible data source connectivity – Pull information from databases, APIs, and file systems
- Extensive customization framework – Tailor every aspect of your dashboard interface
Dashboard tools built on Java frameworks offer stability and scalability that’s essential for home automation systems requiring consistent monitoring and control capabilities.
Real-Time Dashboard Creation
As you plunge into real-time dashboard creation, Dashbuilder’s interactive capabilities transform raw data streams into dynamic visualizations that update automatically.
You’ll harness this Java-based tool’s broad visualization libraries to monitor your home systems effectively. Whether you’re tracking energy consumption, security cameras, or IoT devices, you can create dashboards that refresh continuously with real-time data.
Dashbuilder’s integration with diverse data sources means you’ll connect everything from databases to APIs seamlessly. The tool’s enterprise-grade features, backed by the JBoss community, guarantee reliability for your monitoring applications.
You’ll customize visualizations extensively while leveraging the Apache 2 licensed platform’s collaborative development. This combination of real-time capabilities and visualization flexibility makes Dashbuilder ideal for thorough home monitoring solutions that support informed decision-making.
Re:Dash: Query-Focused Platform for Data Analysis
While most dashboard tools cater to general monitoring needs, Re:Dash takes a different approach by focusing specifically on query-driven data analysis for analysts and data scientists.
You’ll find this platform excels at transforming SQL queries into shareable visualizations, making complex data accessible across your team.
Re:Dash’s strength lies in its analytical capabilities rather than real-time monitoring. You can create collaborative workspaces where team members build dashboard visualizations without extensive programming knowledge.
Key features that make Re:Dash valuable:
- Multi-source connectivity – Supports over 20 data sources including PostgreSQL, BigQuery, and Redshift
- SQL-first approach – Transform queries directly into visual insights
- Collaboration tools – Schedule report updates and share findings seamlessly
- No-code accessibility – Non-technical users can create visualizations easily
- Static data focus – Optimized for analytical reporting over real-time metrics
Stashboard: Service Status Monitoring for Cloud Applications
You’ll need clear visibility into your cloud services and APIs to maintain a reliable home infrastructure.
Stashboard gives you real-time status tracking that works independently from your main applications, ensuring you can monitor service health even during outages.
This Python-based tool displays operational status in an easily digestible format, helping you quickly identify and respond to any service disruptions.
Cloud Service Visibility
When your cloud services go down, you need immediate visibility into what’s working and what isn’t. Stashboard delivers exactly this capability, providing a centralized dashboard that monitors your cloud services and APIs in real-time.
Originally developed by Twilio for their phone service applications, this Python-based tool operates independently from your main infrastructure, ensuring you’ll maintain visibility even during major outages.
The monitoring use case becomes critical when managing multiple cloud services across different providers. Stashboard’s user-friendly interface aggregates status information from various sources, giving you a detailed view of your application health.
- Open source with MIT license for community contributions
- Independent operation maintains visibility during main site outages
- User-friendly interface aggregates multiple service statuses
- Python-based application designed for cloud service monitoring
- Integrates seamlessly into existing workflows for enhanced observability
Real-Time Status Tracking
How quickly can you detect when a critical service fails? Stashboard delivers immediate answers through its Python-based real-time status monitoring system.
Originally developed by Twilio for phone service applications, this tool operates independently to maintain visibility even when your main site goes down.
You’ll appreciate Stashboard’s clean interface that displays service statuses in an easily interpretable up-or-down format. The application helps you manage service reliability across multiple cloud services and APIs.
With its GitHub availability under MIT license, you can customize functionality for specific use cases.
Integration into existing monitoring systems is straightforward, making Stashboard valuable for teams needing simple yet effective service health tracking.
It’s particularly useful for home dashboard setups requiring thorough cloud application monitoring.
Essential Features to Look for in Dashboard Tools
Selecting the right dashboard tool transforms your home monitoring setup from a collection of scattered data points into a cohesive, actionable system.
You’ll want open-source solutions that deliver flexibility without compromising functionality.
When evaluating dashboard tools, focus on these essential features:
- Multiple data source connectivity – Look for tools like Grafana that integrate with Prometheus, InfluxDB, and Graphite for thorough monitoring.
- User-friendly customization – Prioritize drag-and-drop interfaces like Freeboard that don’t require programming expertise.
- DevOps workflow integration – Choose platforms supporting Terraform, Kubernetes, and AWS for seamless automation.
- Real-time alerting capabilities – Guarantee immediate notifications for critical system performance issues.
- Pre-built widgets and themes – Select tools offering ready-made visual components to minimize setup time.
Data Source Integration and Compatibility
Beyond selecting the right features, your dashboard’s effectiveness depends heavily on its ability to connect with your existing data infrastructure.
A dashboard’s true power lies in seamlessly bridging the gap between your data sources and actionable insights.
You’ll find that tools like Grafana and MetricFire excel at integrating with multiple data sources, including Prometheus, Graphite, InfluxDB, Elasticsearch, and MySQL. This versatility lets you visualize data from various origins seamlessly.
If you use API-enabled services, Dashy provides dynamic content integration that enhances functionality considerably.
For those without programming experience, Freeboard offers web API visualization without requiring backend coding skills.
Re:Dash stands out by connecting to over 20 data sources like PostgreSQL, BigQuery, and Redshift, making it perfect for analysts needing quick, shareable visualizations.
Both Mozak and Dashbuilder offer customizable solutions that accommodate diverse data source requirements.
Setup Requirements and Technical Expertise Needed
While data integration capabilities matter greatly, the technical expertise required for setup varies dramatically across open-source dashboard tools.
You’ll find that tools like Grafana demand significant technical knowledge for initial configuration, including understanding data sources and user permissions. However, managed solutions like MetricFire reduce this complexity by handling infrastructure management for you.
Consider these setup requirements:
- Basic tools – Freeboard and Mozak need minimal programming skills but limit complex metrics handling
- Advanced configurations – Grafana requires familiarity with Prometheus, Graphite, or SQL database configurations
- Query languages – You’ll need knowledge of specific query syntaxes for different data sources
- Documentation diving – Expect steep learning curves compared to commercial alternatives
- Community resources – You’ll rely heavily on forums and guides for troubleshooting
Customization Options and User Interface Design
After establishing your technical foundation, you’ll discover that customization options become the defining factor in creating truly personalized home dashboards. Dashy emerges as your tool of choice with extensive interface customization capabilities that transform standard displays into tailored experiences.
| Feature Category | Customization Options | User Benefits |
|---|---|---|
| Visual Design | Built-in themes, UI color editor | Personal aesthetic control |
| Content Display | 50+ widgets, API integration | Dynamic data representation |
| Configuration | YAML files, intuitive UI | Technical flexibility |
You can enhance visual appeal through custom CSS, auto-fetch icons from favicons, and utilize multiple icon libraries. The application supports multi-language functionality, allowing seamless switching between English, German, and French. Configuration management accommodates both technical users preferring YAML files and non-technical users favoring the intuitive interface approach.
Performance Considerations for Large Datasets
Customizing your dashboard’s appearance means nothing if it can’t handle the data you’re feeding it. When your home dashboard processes large datasets for business intelligence, performance becomes critical.
You’ll need tools and techniques that prevent memory overload and guarantee smooth operations.
Essential performance strategies include:
- Use Dask for distributed computing – Break larger-than-memory datasets into manageable dataframes
- Implement Datashader for visualization – Aggregate data onto grids before plotting to reduce memory overhead
- Apply spatial partitioning techniques – Organize data efficiently and process categorical variables strategically
- Enable caching mechanisms – Store processed results to avoid repeated calculations and queries
- Choose optimized visualization libraries – Select tools like Dash that handle extensive datasets with better rendering speed
Choosing the Right Tool for Your Home Lab Needs
Once you’ve optimized your dashboard’s performance capabilities, selecting the right tool becomes your next critical decision. Your choice depends on technical expertise, specific requirements, and intended use cases.
| Tool | Best For | Technical Level | Setup Complexity |
|---|---|---|---|
| Grafana | Professional monitoring | Advanced | High |
| Dashy | Home lab beginners | Beginner | Low |
| Freeboard | IoT projects | Intermediate | Minimal |
| Mozak | Custom development | Advanced | Medium |
Each tool serves distinct purposes. Grafana excels when you need enterprise-grade monitoring with multiple data sources. Dashy’s simplicity makes it perfect for newcomers wanting quick results. Freeboard handles lightweight IoT monitoring without backend complexity. Mozak offers developers maximum customization through JavaScript configuration. Stashboard specifically targets service status monitoring. Consider your technical skills, data sources, and long-term maintenance requirements when making your selection.
Frequently Asked Questions
What Is the Best Software to Create a Dashboard?
You’ll find Grafana’s the industry standard for powerful, customizable dashboards with multiple data source integration. For simpler needs, you can use Freeboard’s drag-and-drop interface or Dashy’s homelab-focused features.
Does Google Have a Dashboard Tool?
Yes, you’ll find Google Data Studio is Google’s free dashboard tool. You can create customizable reports, connect multiple data sources, collaborate with others, and share dashboards easily through links or website embedding.
How to Make a Custom Home Assistant Dashboard?
You’ll create custom Home Assistant dashboards using Lovelace UI through YAML configuration or visual editor. Add entity cards, gauges, and custom cards to display device data, then apply themes and CSS for personalized styling.
Is Metabase for Free?
Yes, you’ll get Metabase’s core features completely free with their open-source version. You can connect to 20+ data sources, build interactive dashboards, and deploy locally using Docker without paying anything.


Leave a Reply