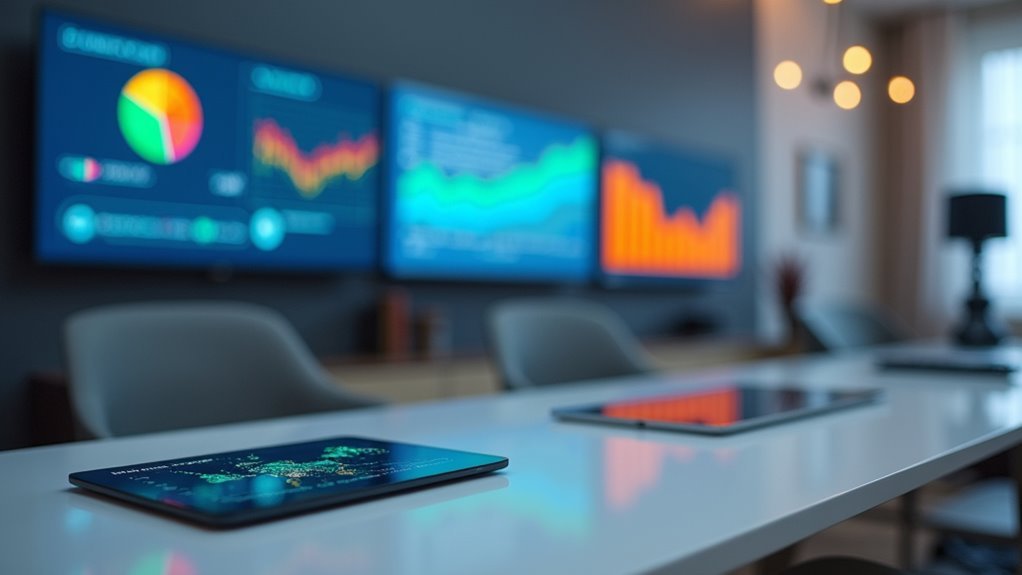
You’ve invested in smart home technology, but you’re drowning in scattered data from multiple devices and apps. Your energy bills spike without warning, security alerts get buried in notifications, and you can’t figure out which appliances are actually making your home more efficient. The solution isn’t buying more gadgets—it’s consolidating everything into a single, powerful dashboard that transforms chaos into actionable insights you’ll actually use.
Microsoft Power BI for Smart Home Analytics

Managing your smart home’s overwhelming data streams becomes effortless with Microsoft Power BI’s extensive analytics platform.
You’ll connect various smart devices and data sources through this powerful tool, creating thorough energy usage and security analysis. The platform’s interactive dashboards showcase trends and patterns, helping you optimize consumption and enhance home security through effective data visualization tools.
Power BI’s analytics capabilities include natural language queries, eliminating the need for advanced technical skills while exploring your smart home analytics.
You’ll receive real-time insights through continuous device monitoring and timely alerts on critical metrics. The seamless integration with Microsoft products enables easy Excel data incorporation into customizable dashboards.
This streamlined approach supports data-driven decision-making, transforming complex smart home information into actionable intelligence for improved household management.
Tableau Public for Real-Time Device Monitoring
You’ll find Tableau Public’s free platform perfectly suited for creating compelling visualizations of your smart home device data streams.
Setting up monitoring dashboards becomes straightforward with its intuitive drag-and-drop interface that connects seamlessly to your CSV files and database feeds.
You can quickly establish real-time connectivity tracking and build extensive dashboard layouts that reveal device performance patterns, usage trends, and connectivity issues across your entire home network.
Real-Time Device Connectivity
Real-time visibility into your connected devices transforms how you monitor and manage your smart home ecosystem. Tableau Public empowers users to create live dashboards that automatically update as new information flows from your IoT devices. You’ll connect multiple data sources seamlessly, from smart thermostats to security cameras, building extensive monitoring systems.
The platform’s drag-and-drop interface eliminates coding complexity while maximizing visualization capabilities. You can develop interactive visualizations featuring dynamic charts and graphs that refresh instantly when device status changes.
Whether tracking energy consumption, temperature fluctuations, or security alerts, your real-time dashboards provide immediate insights into home performance.
Tableau’s sharing features let you share insights with family members or publish dashboards online for community collaboration, making your smart home data accessible to relevant stakeholders.
Monitoring Dashboard Setup
Setting up your monitoring dashboard starts with connecting Tableau Public to your home automation data sources through direct API connections or CSV imports from your IoT platforms.
You’ll leverage Tableau’s data visualization capabilities to create interactive dashboards that track your smart devices in real-time. The drag and drop interface lets you build visually appealing charts and graphs without technical expertise.
Configure real-time dashboards to monitor device performance across your entire home automation system. Use dynamic filtering options to analyze specific data points when troubleshooting or optimizing performance. The platform’s drill-down features help you investigate anomalies quickly.
Access the community gallery for dashboard templates designed specifically for IoT monitoring, giving you proven layouts to accelerate your setup process.
Google Looker Studio for Connected Home Insights

You’ll find Google Looker Studio excels at transforming your connected home’s data streams into actionable insights through its robust real-time analytics capabilities.
The platform seamlessly connects with your smart thermostats, security cameras, and IoT sensors to create detailed dashboards that track everything from energy consumption patterns to device performance metrics.
You can monitor your home’s operational efficiency as it happens, enabling immediate adjustments to optimize comfort and reduce costs.
Real-Time Home Analytics
When managing a connected home becomes overwhelming with scattered data from multiple smart devices, Google Looker Studio emerges as a powerful solution that consolidates all your home analytics into a single, real-time dashboard.
You’ll gain immediate access to live metrics through interactive visualization tools that transform complex data aggregation into digestible insights. The platform’s real-time data capabilities let you monitor energy usage patterns, security alerts, and appliance performance as they happen, enabling swift decision-making when conditions change.
Your dashboards update automatically, providing continuous analytics without manual intervention. This thorough approach to home monitoring guarantees you’re always informed about your smart home’s operational status, helping you optimize resource management and maintain efficient household operations through data-driven insights.
Smart Device Integration
Dozens of smart devices scattered throughout your home generate valuable data streams that Google Looker Studio effortlessly consolidates into meaningful visualizations.
This analytics platform excels at smart device integration, allowing you to create dashboards that pull data from thermostats, security cameras, and other connected devices into one centralized hub.
You’ll benefit from real-time monitoring capabilities that track energy usage and security metrics as they happen.
The user-friendly drag-and-drop interface lets you build customizable dashboards without technical expertise, while collaboration features enable you to share insights with family members or service providers.
Google Looker Studio’s data visualization capabilities transform raw device data into actionable insights, helping you make informed decisions about your home’s automation and efficiency.
Grafana for IoT Device Visualization
Millions of IoT devices generate massive streams of time-series data that need effective visualization, and Grafana stands out as the go-to open-source platform for transforming this raw information into actionable insights.
You’ll appreciate its compatibility with popular data sources like InfluxDB, Prometheus, and Elasticsearch, enabling seamless consolidation of your IoT devices’ metrics.
Grafana’s customizable dashboards let you create interactive visualizations including graphs, heat maps, and gauges tailored to your specific monitoring needs.
The platform delivers real-time insights while its built-in alerting features notify you of critical anomalies, ensuring prompt responses to potential issues.
As an extensible platform, Grafana offers numerous plugins and integrations that enhance your data visualization capabilities for thorough IoT device management.
Home Assistant Dashboard for Comprehensive Control

You’ll find Home Assistant’s device integration setup incredibly straightforward, as it automatically discovers most smart home devices on your network and supports manual configuration for hundreds of brands through its extensive ecosystem.
The platform’s real-time monitoring features let you track everything from temperature sensors to security cameras in one unified dashboard, giving you instant visibility into your home’s status.
You can customize these monitoring displays using either YAML configuration or the visual editor to create graphs, gauges, and other visualizations that match your specific needs.
Device Integration Setup
Over 1,500 compatible integrations make Home Assistant one of the most versatile platforms for centralizing your smart home control through a single, all-encompassing dashboard. You’ll find device integration straightforward, connecting everything from lighting and heating to security systems seamlessly. The customizable dashboard displays real-time data including energy consumption and device status, giving you complete visibility into your home’s operations.
| Integration Type | Examples |
|---|---|
| Lighting Control | Philips Hue, LIFX, Smart Switches |
| Climate Systems | Nest, Ecobee, Smart Thermostats |
| Security Devices | Ring, Arlo, Door Sensors |
You can monitor and manage your entire setup remotely through mobile devices or web browsers. The platform’s automation capabilities let you create custom triggers and conditions, transforming basic data visualization into intelligent home management that responds to your lifestyle patterns.
Real-Time Monitoring Features
How effectively can you monitor your smart home’s performance when every device operates independently? Home Assistant’s real-time monitoring transforms scattered data into unified insights. You’ll track energy usage, security systems, and environmental conditions through customizable widgets that display what matters most to your daily routine.
The platform’s data visualization tools create compelling graphs and charts, presenting both live updates and historical trends. You can configure alerts and notifications for critical events like security breaches or unusual energy consumption spikes.
Interactive reports help you analyze patterns and optimize home efficiency. Your dashboard becomes a command center where multiple smart devices converge into one all-encompassing interface, enabling informed decisions about resource management and home automation optimization.
Databox for Smart Home KPI Tracking
Smart home enthusiasts who need extensive KPI tracking will find Databox’s robust integration capabilities particularly valuable.
You’ll access over 70 one-click integrations with popular smart home devices and platforms, enabling thorough data visualization across your entire home automation ecosystem.
The platform’s customizable dashboards let you monitor real-time energy consumption, security status, and overall home efficiency from multiple devices simultaneously.
You can use the intuitive drag-and-drop editor to create tailored dashboards highlighting specific KPIs like energy savings, appliance usage, and security alerts.
Databox’s mobile-friendly app keeps you connected to your smart home performance anywhere.
The generous free plan allows three data sources and three dashboards, making professional-grade KPI tracking accessible without financial commitment for optimizing your smart home systems.
Node-RED Dashboard for Custom Automation Displays
Custom automation displays reach new heights with Node-RED Dashboard’s powerful visual creation capabilities.
You’ll create custom visualizations through its intuitive drag-and-drop interface, building interactive charts, gauges, and sliders without coding expertise. This open-source platform excels at data visualization by seamlessly integrating multiple protocols like MQTT, HTTP, and WebSocket to collect information from your IoT sensors and devices.
Real-time monitoring becomes effortless as you track your home automation systems through dynamic displays.
Node-RED’s mobile responsiveness guarantees you’ll access your dashboards anywhere using smartphones or tablets. The platform’s extensibility shines through community-contributed nodes and templates that enhance functionality.
You’ll appreciate how Node-RED transforms complex automation data into clear, actionable insights while maintaining complete customization control over your visualization layouts and interactive elements.
ThingSpeak for Sensor Data Visualization
Real-time sensor monitoring transforms into actionable intelligence through ThingSpeak’s extensive IoT analytics platform. You’ll collect, store, and analyze data from multiple IoT devices while leveraging MATLAB integration for advanced processing capabilities. The platform supports up to 8 fields per channel with 15-second data intervals, ensuring thorough real-time sensor data capture.
You can create visualizations including line graphs, bar charts, and gauges that reveal meaningful insights from your sensor networks. ThingSpeak’s built-in support for MQTT enables seamless device communication and remote monitoring capabilities.
| Feature | Capability |
|---|---|
| Data Storage | 8 fields per channel |
| Update Frequency | 15-second intervals |
| Visualization Types | Graphs, charts, gauges |
| Integration | MATLAB analytics |
| Connectivity | MQTT protocol support |
Zoho Analytics for Energy Consumption Monitoring
Energy costs continue climbing while households search for effective ways to track and reduce their consumption.
Zoho Analytics delivers robust data visualization capabilities that transform your energy management systems into actionable insights. You’ll create customizable dashboards displaying usage patterns, peak consumption periods, and savings opportunities with visual clarity.
The platform’s real-time data updates enable immediate awareness of consumption changes, helping you make timely efficiency adjustments. Its predictive analysis feature forecasts future energy needs based on historical trends, supporting proactive planning.
You can generate thorough energy consumption reports and utilize collaborative sharing options to discuss findings with family members or contractors. This combination of monitoring tools and sustainability strategies positions Zoho Analytics as an invaluable resource for energy-conscious homeowners.
OpenHAB for Unified Smart Device Management
Managing multiple smart devices from different manufacturers often creates a fragmented experience where you’re juggling various apps and interfaces. OpenHAB solves this challenge by providing a unified platform that integrates all your smart devices into one thorough dashboard.
You can connect devices using Z-Wave, Zigbee, MQTT, and HTTP protocols, ensuring seamless compatibility across brands.
The platform’s user interface lets you create customized dashboards and visualizations for real-time monitoring of your home systems. You’ll control lighting, security, and climate from a single location.
OpenHAB’s automation capabilities enable you to set up rules based on specific conditions, streamlining your smart home management. With extensive add-ons supporting Amazon Alexa, Google Assistant, and Philips Hue, you’ll achieve true integration across your entire smart home ecosystem.
Frequently Asked Questions
Which Tool Is Most Used for Data Visualization?
You’ll find Microsoft Power BI and Tableau are the most widely used data visualization tools. Power BI’s strong Microsoft integration and Tableau’s user-friendly interface make them top choices for professionals.
Can Chatgpt Create Dashboards?
You can’t create visual dashboards directly with ChatGPT, but you’ll get guidance on dashboard design, tool selection like Tableau or Power BI, coding snippets, and visualization best practices.
Which Tool Is Best for Dashboards?
You’ll find Microsoft Power BI best for extensive analytics with Microsoft integration, while Google Data Studio excels for team collaboration. Choose Databox if you’re starting small with limited data sources.
Does Google Have a Dashboard Tool?
Yes, you can use Google Data Studio, Google’s free dashboard tool. You’ll create customizable reports and visualizations by connecting various data sources. It’s user-friendly with drag-and-drop features and real-time updates.


Leave a Reply