
You’re probably staring at a collection of smart devices scattered across different apps, wondering how to bring order to the chaos. Creating an effective home monitoring dashboard doesn’t require technical expertise—it’s about understanding which information matters most to you and organizing it logically. The secret lies in knowing where to start and which components will actually improve your daily routine, rather than adding unnecessary complexity to your setup.
Understanding Your Home Monitoring Needs
How often do you find yourself checking multiple apps just to see if your front door’s locked or whether your thermostat’s running efficiently? This scattered approach wastes time and creates unnecessary stress.
Your smart home monitoring needs depend on your daily routines and priorities. Users need to identify which devices matter most to their household operations.
Effective smart home management starts with understanding which devices align with your lifestyle and checking habits.
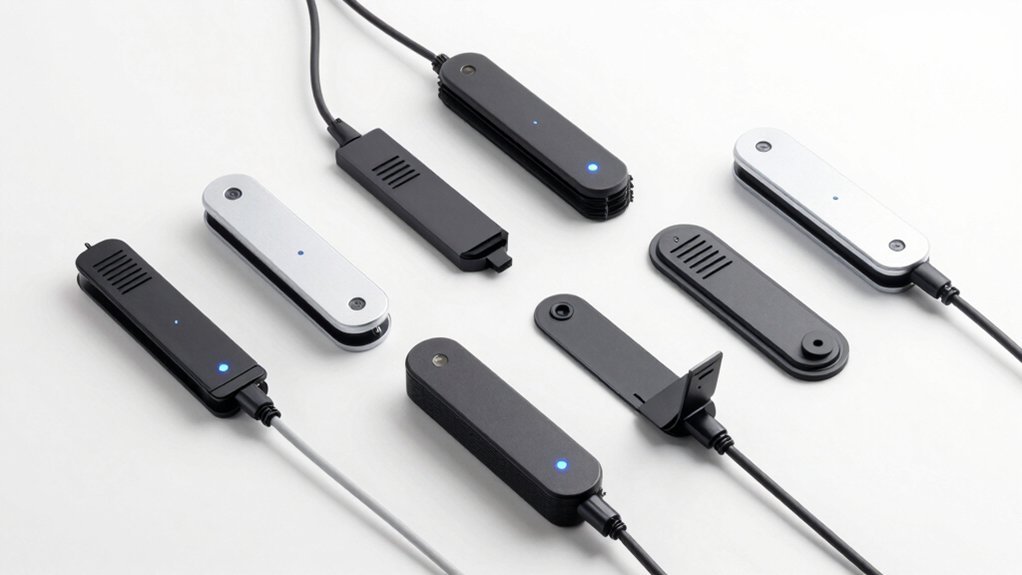
Start by cataloging your current smart devices and noting which ones you check frequently. Security features like door locks and cameras typically rank highest, followed by energy management tools like thermostats and smart plugs.
Environmental monitoring, including air quality and weather sensors, rounds out most homeowners’ priorities.
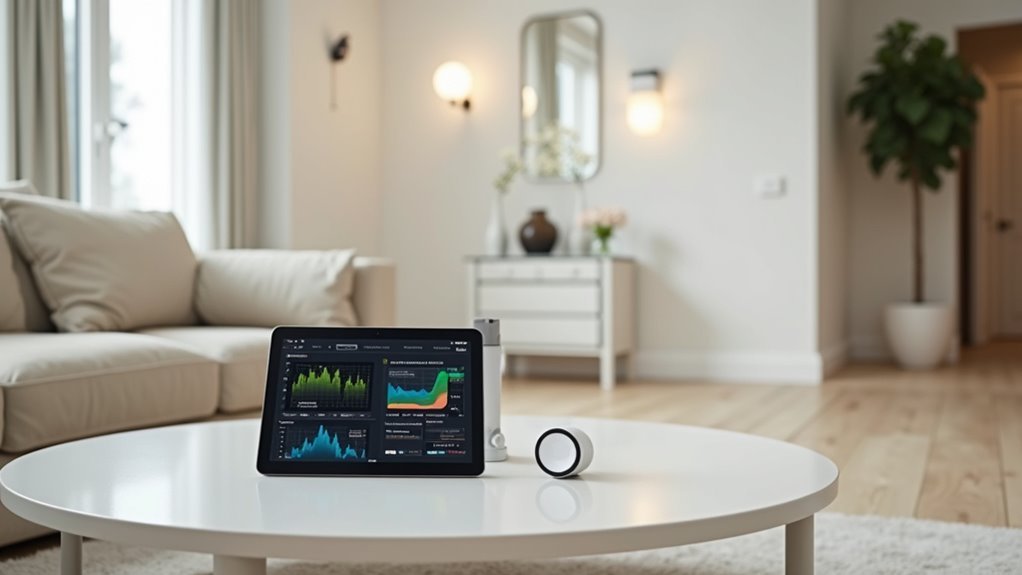
Consider how you want to display information—whether through quick status indicators or detailed analytics that help you make informed decisions about your home’s performance.
Essential Components for Smart Home Dashboards
While creating an effective smart home dashboard might seem overwhelming, focusing on five core components will transform your scattered device management into a streamlined control center.
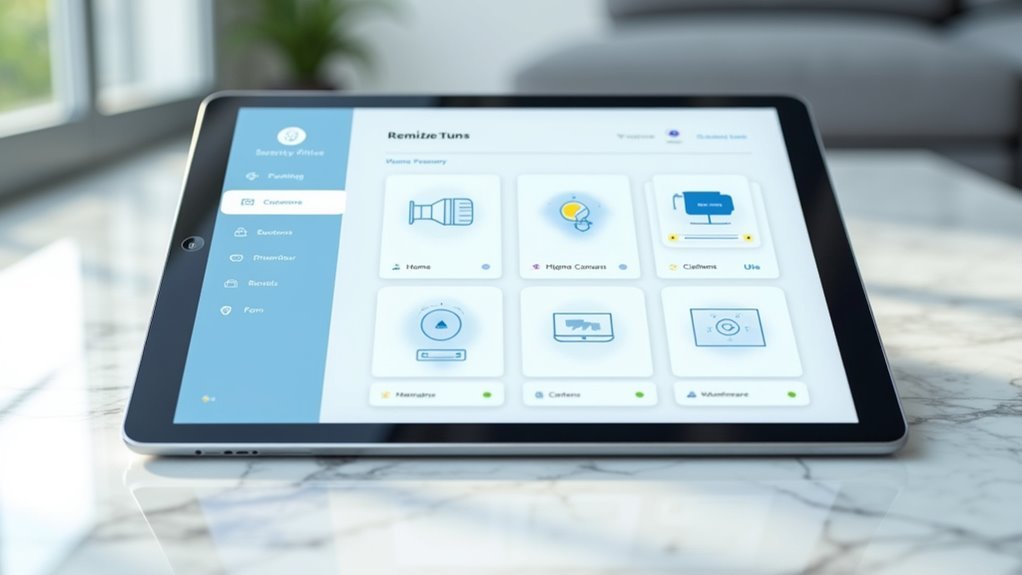
Your dashboard needs a unified real-time monitoring interface that displays device statuses instantly. You’ll want customizable tiles featuring clear icons, labels, and intuitive color coding that help users understand their home’s status at a glance.
Integration capabilities are vital – your dashboard must connect with popular hubs and support a wide range of smart devices including lights, plugs, sensors, and thermostats.
Essential components include:
- Real-time status monitoring for instant device visibility
- Customizable tile layouts with personalized icons and colors
- Comprehensive device integration across multiple smart home platforms
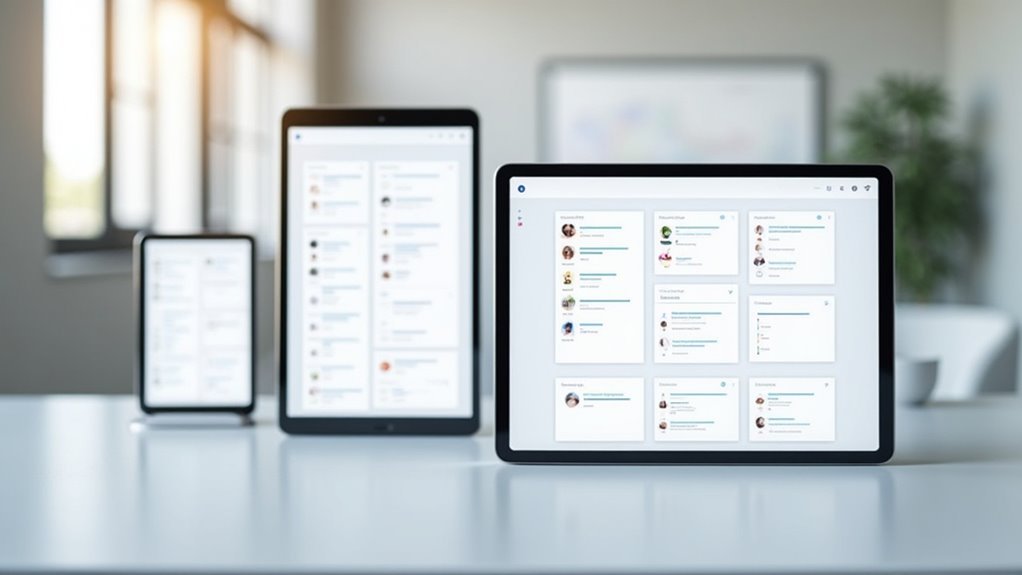
- Responsive web interface for access from any device
These elements create an efficient, user-friendly control experience.
Choosing the Right Dashboard Layout Structure
Which layout structure will best serve your smart home monitoring needs? You’ll want to prioritize clarity and simplicity, enabling quick access to relevant information without excessive navigation.
A grid-based layout works best for organizing dashboard elements effectively, allowing you to customize tiles and arrange them according to your preferences.
Choose a responsive design that adapts seamlessly across mobile and desktop devices. This guarantees you can monitor your devices together regardless of screen size.
Incorporate visual hierarchy using size, color, and positioning to emphasize critical information, helping users see status at a glance.
Most importantly, select a structure offering drag-and-drop customization. This empowers you to personalize your dashboard layout according to your specific monitoring requirements and workflow preferences.
Real-Time Data Visualization Techniques
You’ll want to implement live device status updates that refresh automatically, showing your smart home’s current state without manual intervention.
Interactive chart components let you click, hover, and manipulate data visualizations to explore trends and patterns in your home’s performance.
Color-coded performance metrics provide instant visual cues—you’ll immediately recognize when systems are running smoothly or need attention through strategic use of greens, reds, and warning colors.
Live Device Status Updates
When you’re managing a smart home, seeing your device status in real-time transforms how you interact with your living space.
Live updates from one central dashboard eliminate guesswork about whether your doors are locked, lights are on, or security cameras are recording. You’ll instantly know your home’s current state without checking individual devices.
- Immediate feedback shows door locks, lighting status, and appliance conditions as they change
- Live camera feeds display current views directly on your dashboard interface
- Color-coded indicators help you quickly identify device status across multiple systems
- Temperature and sensor readings update continuously for accurate environmental monitoring
Make sure your dashboard’s responsive design works seamlessly across phones, tablets, and computers, giving you complete control whether you’re home or away.
Interactive Chart Components
Beyond basic status indicators, interactive charts transform raw data streams into meaningful visual insights that help you understand patterns in your home’s behavior.
You’ll want charts that update instantaneously, displaying energy consumption trends, device connectivity metrics, and security alerts in real-time. Dynamic graphs and gauges make it easy to spot anomalies quickly—like unusual power spikes or connectivity drops.
Implement color coding strategically: green for normal operations, yellow for warnings, and red for critical alerts. This visual hierarchy guarantees you’ll identify issues at a glance.
Your charts should be responsive, adapting seamlessly to phones, tablets, and desktop screens. Choose components that allow zooming, filtering, and drilling down into specific timeframes, giving you complete control over how you analyze your smart home’s performance data.
Color-Coded Performance Metrics
Since your brain processes color information faster than text or numerical data, implementing strategic color schemes becomes essential for instant performance assessment across your smart home devices.
You’ll want to adopt the proven red-yellow-green system where red signals critical issues requiring immediate attention, yellow indicates warnings that need monitoring, and green shows ideal functioning.
Consider implementing emotional color coding to enhance intuitive understanding:
- Use blue tones for nighttime energy usage patterns and security monitoring
- Apply orange hues for morning activity alerts and peak consumption periods
- Integrate real-time bar graphs with consistent color schemes across all dashboard elements
- Deploy pie charts with color-coded segments for quick device performance comparison
This consistent approach eliminates guesswork and reduces the learning curve for household members.
Device Integration and Compatibility Planning
When designing your home monitoring dashboard, you’ll need to guarantee your chosen platform works seamlessly with popular smart home hubs like SmartThings, Hubitat, Homey, and Home Assistant.
Your device connection setup should prioritize compatibility across a wide range of smart devices, from lights and plugs to sensors, thermostats, and locks.
You’ll want to establish reliable communication protocols that allow real-time data flow between all connected devices and your central dashboard interface.
Platform Hub Compatibility
Although smart home ecosystems often operate in silos, effective dashboard design requires seamless integration across multiple platform hubs to maximize functionality.
Your dashboard’s compatibility with popular hubs like SmartThings, Hubitat, Homey, and Home Assistant guarantees you can connect devices regardless of their manufacturer or protocol. This cross-platform approach eliminates the frustration of managing separate apps for different devices.
When selecting platform compatibility, consider these key integration capabilities:
- Device diversity – Connect lights, plugs, sensors, thermostats, and locks through a single interface
- Live monitoring – Stream real-time feeds from cameras and weather sensors directly to your dashboard
- Calendar integration – Automate tasks and schedules based on specific events or timeframes
- Unified control – Manage all connected devices without switching between multiple applications
Device Connection Setup
Three critical steps form the foundation of successful device connection setup: discovery, pairing, and configuration. You’ll start by scanning your network through your chosen hub to identify compatible devices. Next, you’ll pair each device following manufacturer protocols, guaranteeing secure connections.
| Device Type | Connection Method | Setup Time |
|---|---|---|
| Smart Lights | Zigbee/Z-Wave | 2-5 minutes |
| Door Sensors | Wireless Protocol | 1-3 minutes |
| Thermostats | Wi-Fi/Hub Protocol | 5-10 minutes |
During configuration, you’ll assign device names, set locations, and establish initial parameters. Your dashboard will display real-time status updates—showing locked doors, active lights, and sensor readings. This immediate visibility guarantees you’re monitoring everything effectively. Remember to test each connection thoroughly before moving to dashboard customization.
User Interface Design Best Practices
Since your home monitoring dashboard serves as the primary interface between you and your smart home ecosystem, its design must prioritize user experience above all else.
A well-designed home monitoring dashboard prioritizes seamless user experience as the foundation of effective smart home control.
You’ll want to focus on clarity and simplicity, ensuring users can quickly locate relevant information without distractions cluttering the interface.
Establish a strong visual hierarchy using varying font sizes, colors, and strategic spacing to direct attention toward critical data points. Interactive elements like buttons and sliders should allow customization based on user preferences.
- Maintain consistent color schemes, typography, and icon styles throughout your dashboard
- Use clear visual hierarchy to highlight the most important information first
- Include interactive elements that let users personalize their experience
- Regularly collect and implement user feedback for continuous improvement
Customizing Widgets and Control Panels
How effectively can your dashboard serve your needs if it doesn’t adapt to your unique monitoring priorities? You’ll want to leverage the intuitive drag-and-drop functionality to arrange widgets exactly where they’re most useful.
Customize each tile with specific icons, labels, colors, and styles that make sense for your monitoring workflow. This visual distinction helps you quickly identify and control different devices.
Optimize your layout for both landscape and portrait orientations, ensuring seamless operation regardless of your screen size. For sensitive controls, implement PIN protection to prevent unauthorized access.
Don’t forget to integrate live feeds like security cameras and weather forecasts directly into your dashboard. These real-time elements provide extensive visibility without requiring multiple applications.
Setting Up Automated Alerts and Notifications
While customizing your dashboard creates the perfect visual interface, your monitoring system becomes truly proactive when you configure intelligent alerts that keep you informed of critical events.
Transform passive home monitoring into an active security partner through intelligent alerts that instantly notify you of any critical events requiring immediate attention.
You’ll receive instant notifications about open doors, unusual temperature fluctuations, or any security concerns that require immediate attention. Your smart home app lets you customize these alerts based on your specific preferences and lifestyle needs.
- Real-time notifications – Get push notifications, emails, or SMS alerts when sensors detect unusual activity or threshold breaches
- Location-based reminders – Receive automated prompts when leaving home about open doors or unsecured windows
- Conditional alerts – Set up notifications triggered by specific conditions like humidity levels or motion detection
- Multi-device integration – Connect cameras, sensors, and smart locks for thorough home status updates
Mobile Responsive Dashboard Optimization
Although your automated alerts keep you connected to your home’s status, accessing your dashboard from mobile devices requires careful optimization to maintain the same level of control and visibility you’d have on a desktop computer.
You’ll want to implement responsive design techniques like media queries that automatically resize buttons and tiles for different screen sizes. A drag-and-drop layout lets you customize your dashboard’s organization to fit your preferences, whether you’re using a smartphone or tablet.
Touch-friendly controls are essential for easy navigation on mobile devices, allowing you to manage your home monitoring system effortlessly while away.
Studies show that mobile-responsive designs greatly increase user engagement across all devices.
Security Features and Access Controls
Beyond ensuring your dashboard works seamlessly across devices, protecting your home monitoring system requires robust security measures that prevent unauthorized access to your smart home controls.
Robust security measures are essential to prevent unauthorized access to your smart home monitoring dashboard and connected devices.
You’ll want to implement PIN protection for sensitive features, ensuring only authorized family members can adjust critical settings like security cameras or door locks.
Your dashboard should include view-only modes that let guests see device status without controlling anything.
Real-time monitoring displays help you quickly assess your home’s security status at a glance, showing locked doors and active cameras immediately.
Key security features to implement:
- PIN-protected controls for sensitive smart home devices
- View-only access modes for limited user permissions
- Real-time status monitoring for critical security devices
- Automated notifications for unusual activities or device changes
Performance Monitoring and System Health
You’ll need thorough performance monitoring capabilities to maintain a healthy smart home ecosystem through real-time device status tracking, intelligent system alert configuration, and detailed performance metrics analysis.
Your dashboard should display live connectivity states, battery levels, and operational status for every connected device while automatically notifying you of potential issues before they become problems.
You can optimize your entire system’s efficiency by implementing robust performance metrics that track energy consumption patterns, response times, and device activity trends over time.
Real-Time Device Status
The heart of any effective home monitoring dashboard lies in its ability to display real-time device status, giving you instant visibility into your smart home’s operational state.
You’ll see whether doors are locked, lights are on, or security cameras are functioning properly—all at a glance.
Your dashboard should use visual indicators like color-coded alerts to communicate device health and performance status instantly. This enhances your awareness and helps you identify issues before they become problems.
- Live updates enable immediate troubleshooting of connectivity issues or device malfunctions
- Integration supports diverse devices including sensors, thermostats, and security cameras for thorough monitoring
- Energy usage statistics help you optimize your setup for efficiency and cost savings
- Visual health indicators provide quick status assessment of your entire smart home system
System Alert Configuration
While real-time status visibility keeps you informed of current conditions, proactive alert configuration transforms your dashboard from a passive display into an intelligent monitoring system that anticipates problems.
You can customize alert thresholds for each device, ensuring you’re notified when performance drops below acceptable levels. Set up notifications for critical metrics like connectivity issues, power consumption spikes, or device malfunctions.
Your alerts integrate seamlessly with communication platforms you already use—email, SMS, or messaging apps—guaranteeing you won’t miss important notifications.
Monitor device status parameters including connectivity strength and power usage patterns to maintain ideal performance. This proactive approach greatly reduces system downtime and enhances your smart home’s overall reliability by catching issues before they become major problems.
Performance Metrics Tracking
Beyond basic alerts, thorough performance metrics tracking empowers you to understand your smart home’s operational health through detailed data analysis.
You’ll monitor real-time status across all connected devices, from lighting and security systems to HVAC units, creating an extensive view of your home’s performance.
Setting custom thresholds for critical metrics like energy consumption and response times helps you identify potential issues before they become costly problems.
Visual dashboards with graphs and charts make it easy to spot trends and patterns in your data.
- Real-time monitoring of device status and health across all smart home systems
- Custom alerts for energy consumption, response times, and performance thresholds
- Visual analytics with charts and graphs for quick trend identification
- Proactive maintenance insights to improve efficiency and reduce operational costs
Testing Your Dashboard Configuration
How can you be certain your home monitoring dashboard will perform reliably when you need it most? Start by verifying all device connections are properly established and powered on for accurate monitoring data.
Use the interactive demo dashboard to simulate different configurations and observe how modifications affect device control and visual displays.
Conduct real-time testing by manually triggering your automations and watching for immediate device responses. This confirms your programming works correctly.
Take advantage of built-in feedback mechanisms to gather user experience insights and pinpoint configuration improvements.
Don’t forget to regularly review your dashboard layout and tile customization. Analyze usage patterns to enhance accessibility and operational efficiency, ensuring your monitoring system remains optimized for your specific needs.
Troubleshooting Common Setup Issues
When you’re setting up your home monitoring dashboard, you’ll likely encounter device connection failures that prevent your smart devices from communicating with the system.
Dashboard display problems can also frustrate your setup process, causing incorrect data visualization or interface glitches that make navigation difficult.
Understanding these common issues and their solutions will help you troubleshoot effectively and get your dashboard running smoothly.
Device Connection Failures
Nothing frustrates smart home enthusiasts more than devices that won’t connect to your monitoring dashboard. When you’re facing connection failures, systematically work through these troubleshooting steps to restore functionality.
Start by verifying your device compatibility with your chosen hub or platform, as mismatched systems create immediate roadblocks. Check that all devices remain within your Wi-Fi network’s range, since weak signals prevent reliable communication.
- Restart your router and smart devices to refresh connections and clear temporary glitches.
- Update firmware on both devices and apps, as outdated software causes connectivity problems.
- Review device settings in your app to confirm proper configuration and network permissions.
- Verify compatibility between all smart devices and your monitoring platform before installation.
These steps resolve most connection issues quickly.
Dashboard Display Problems
After establishing device connections, you’ll likely encounter dashboard display problems that prevent you from accessing critical smart home data. The most common issue stems from incorrect sourcetype selection during data ingestion, which breaks down your data’s parsing into searchable key/value pairs.
When you can’t see your device information properly formatted, troubleshooting becomes nearly impossible.
You’ll also face visualization problems when your dashboard can’t interpret the incoming data streams correctly. Check your data parsing configuration first, then verify that your sourcetype matches your device’s data format.
If you’re still experiencing blank widgets or missing information, review your field extraction settings. These dashboard display issues often cascade into bigger problems, making it essential to address parsing and sourcetype configuration before moving forward with automation setup.
Advanced Automation and Scheduling Options
As your smart home ecosystem grows more sophisticated, you’ll want automation capabilities that go beyond simple on-off commands.
Advanced automation options let you create complex routines that respond to specific conditions like time, device status, or environmental changes. You can schedule precise activation times that align with your daily routine, while defining multiple triggers and actions within single automations for seamless device interactions.
- Intuitive drag-and-drop interface – Create complex automations without technical expertise through visual workflow building
- Multi-condition triggers – Set routines based on time, weather, device status, or sensor readings for precise control
- Comprehensive scheduling – Program automations for specific times, days, or recurring patterns that match your lifestyle
- Testing capabilities – Preview automation outcomes before implementation to guarantee they work as intended
Frequently Asked Questions
How Do I Create a Monitoring Dashboard?
You’ll select a user-friendly platform like Splunk, arrange components using drag-and-drop interfaces, incorporate live device feeds, customize tiles with relevant icons and colors, then test thoroughly for accurate data representation.
How to Create a Dashboard Design?
Start by sketching your layout and identifying key data you’ll display. Choose a consistent color scheme and typography. Organize information hierarchically, placing critical elements prominently. Use wireframing tools to create prototypes before finalizing your design.
What Is the Difference Between Dashboard and Home Screen?
You’ll find dashboards display real-time data and interactive controls for monitoring multiple systems simultaneously, while home screens serve as static navigation interfaces with app icons for accessing individual features and applications.
What Is an UI Dashboard?
A UI dashboard is a visual interface that displays your key data and metrics in an organized format. You’ll see interactive cards presenting real-time information, helping you quickly understand and navigate important data points.
Leave a Reply